By ASM Mohiuddin, P Cox and B Blayney.
First published in Water e-Journal Vol 5 No 1 2020.
Abstract
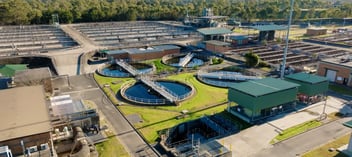
 Figure 1: Warragamba Dam, 2,027 GL operating capacity with 9,051 square kilometres catchment
Sydney’s eleven dams can store 2,581 billion litres of raw water (the largest, Warragamba Dam can store 2,027 billion litres water (Figure 1). Nine water filtration plants (WFPs) in Sydney produce 600 billion litres of drinking water every year.
By 2007, due to the Millennium Drought, dam total storage dropped below 35% capacity. As the Millennium Drought broke, a significant change in raw water characteristics developed causing a 50% reduction in Sydney’s WFP production capacity.
Through its response efforts, Sydney Water has achieved a 20-30% increase (400 million litres per day) in production capacity from the initial constrained capacity, and thus secured water supply to the expanding city.
Introduction
Nine WFPs either operated directly or contracted by Sydney Water produce around 600 billion litres of high quality drinking water every year for about five million people in Greater Sydney. Eight of these WFPs use direct filtration with ferric chloride as the primary coagulant and polyDADMAC as secondary coagulant.
By 2007, due to the Millennium Drought, Sydney’s total storage in eleven dams dropped below 35% of the total storage capacity of 2,581 billion litres, then gradually increased to above 90% in the following ten years
(Figure 2).
Figure 2: Total dam storage levels in Sydney
(source: WaterNSW website "Greater Sydney water storage and supply report" )
As the Millennium Drought was breaking with the return of more frequent catchment rainfall, a significant change in raw water characteristics occurred. This caused a 50% reduction of Sydney’s WFP production capacity from their original design capacity of 4,000 million litres/day, and thus generated a risk to supply safe drinking water to its customers during peak summer demand period.
While water use per customer fell during the Millennium Drought, population growth was beginning to partially offset the drought-induced fall in total water demand.
Methodology/Process
To identify the root cause of WFPs capacity deterioration and to secure safe drinking water for Sydney, Sydney Water carried out the following activities over the last ten years.
Raw water analysis and organic characterisation
As presented in Figure 3 and 4, historical trends of the raw water at the WFPs indicates a 50-100% increase in dissolved organic carbon (DOC) which is represented by the same increased profile in true colour, since the breaking of the Millennium Drought.
Figure 3: Raw water quality trend – Nepean WFP. Note the shift in baseline levels of DOC (and its surrogate, true colour) from 2001 levels to 2012 onwards. Spikes in both parameters were due to catchment rainfall events.
Figure 4: Raw water quality trend – Prospect WFP. The baseline shift in DOC and true colour are similar to those in Nepean raw water.
Sydney Water carried out several organic fractionations of the DOC for raw water at the inlet of multiple WFPs. DOC fractions (Very Hydrophobic Acids (VHA), Slightly Hydrophobic Acids (SHA), Charged Hydrophilics (CHA) and Neutral Hydrophilics (NEU)), were correlated with water true colour and filter performances (Figure 5 and 6).
Figure 5: Impact of organic fraction (VHA) on Filter run time (hr) and Unit Filter Run Volume (UFRV) at Nepean WFP
Figure 6: Relationship of DOC fractions with true colour – Nepean Dam water and raw water at Nepean WFP
(sample collected in 2016 and 2017)
Catchment characterisation and treatability of raw water
Sydney Water, with catchment manager WaterNSW and research partner UNSW, were awarded an ARC Linkage grant in 2015 to better identify the raw water components impacting on floc strength and treatability, develop early warning monitoring systems for these components, and identify their sources.
Advanced process optimisation, modelling and extensive pilot plant trials
Sydney Water, in partnership with TRILITY Pty Ltd and NSW Public Works, completed a detailed study on treatability of high colour combined with low turbidity raw water at Macarthur and Nepean WFPs. This study included desktop research, raw water characterisation and a pilot plant trial.
Sydney Water developed a process model and advanced process optimisation to correlate raw water characteristics with filter performance and chemical dosing.
At the same time Sydney Water, in partnership with SUEZ and Veolia, completed extensive pilot plant trials to identify the coagulation regime for raw water which is difficult-to-coagulate.
Catchment to customer water quality risk assessments
Sydney Water completed catchment to customer (strategic) and operational system risk assessments to identify the bottlenecks at the WFPs production capacity, which helped to inform the planning studies.
Process capability assessment (PCA) and system blueprints
Engaging expert consultants in the water industry, Sydney Water completed a Process Capability Assessment (PCA) for each WFP. The PCA reports informed the System Blueprint study, which captured the assets’ capability and upgrade requirements for treatment plants and networks.
Water master planning
Sydney Water is currently developing a Water Master Plan to identify options for the future water supply of the growing city, which includes the challenges provided by resilience through drought, changing raw water quality, the limits of current WFP processes, and tightening drinking water targets, as well as alternate sources of water, demand management options, customer preferences and regulatory considerations.
Results/outcomes
From raw water characterisation and data analysis for two dams, Nepean and Warragamba, it has been identified that drought break rain increased the true colour in raw water which is due to increased level of DOC in the dam (Figure 3 and 4). The DOC fractionations of high-colour raw water revealed that, as the true colour of raw water increased the very hydrophobic acid (VHA) fraction of the DOC increased in raw water.
Analysis of raw water quality for Nepean WFP found a linear relationship between VHA fraction of DOC with true colour of raw water. The exact linear relationship between VHA and true colour of raw water will vary from catchment to catchment in Sydney, and for Nepean Dam the relationship is shown in Figure 6.
The high-colour raw water events were analysed with plant performance information at the same period. Increased DOC with increased true colour and elevated fractions of DOC in raw water have been identified as the root cause for weak flocs formation during treatment, leading to decreased filtration rates, plant production capacity and filter performance.
True colour is a reflection of various compounds in the raw water. Data analysis of raw water from two sources, Nepean and Macarthur, showed that true colour increase in raw water following drought break rain is mainly due to the organic fractions (Table 1), and hence it is used as a surrogate parameter to reflect organic matter in water (Mohiuddin et al. 2014).
Table 1: Organic characterisation of raw water to WFP in 2012
Data analysis of true colour and VHA fraction of raw water, and Nepean WFP’s dual media filters run time and unit filter run volume (UFRV) found that, true colour of raw water is correlated with VHA fraction of DOC (Figure 6) and increase in VHA concentration or DOC caused decrease in filter performance by significantly reducing filter run time and UFRV (Figure 5). This reduction of filter run time is due to weak flocs formation during coagulation flocculation process which caused turbidity breakthroughs in filters.
While it was identified that, formation of ‘weak flocs’ at higher DOC or NOM in raw water is the root cause for poor filter performance, there was no method to measure floc strength in standard chemicals optimisation using jar tests at water treatment plants.
Sydney Water with its research partner UNSW, as part of ARC Linkage program, focused to innovate an instrument and thus developed a floc strength instrument (FSI) based on computational fluid dynamics (CFD) replicating shear distribution in filters (Bustamante et al. 2018). FSI was successful to measure floc strength at various chemicals dose in jar tests, and can help to optimise chemicals dose to improve filter performance.
As a result of this research, Sydney Water now has an instrument that will enable treatment plant operators to rapidly determine the effect of changes in water quality in terms of NOMs and adjust chemicals to treat raw water and maximise water production (Bustamante et al. 2018).
The detailed study for optimisation and process modelling work carried out using various combination of coagulants dose in Jar tests and pilot plants predominantly focused on improving ‘floc strength’ to improve filter performance. The jar tests and pilot plant trials concluded that high true colour raw water is coagulable using Sydney Water’s current primary coagulant ferric chloride, secondary coagulant polyDADMAC and non-ionic polymer (polyacrylamide) as coagulation aid.
The tests demonstrated that reduced ferric chloride dose decreased the floc size and the smaller the floc size the better is the filter performance. As the floc size increases it is more prone to break-up when exposed to shear force in filters causing filter turbidity breakthroughs. On the other hand, tests with high true colour raw water showed that, increase of polyDADMAC dose reduces the floc size.
As a result, it was identified from pilot plant trials that a combination of reduced ferric chloride and increased polyDADMAC dose improved ‘floc strength’ and achieved longer filter run times. Therefore, Sydney Water’s studies with NSW public works recommended optimum operation at increased polyDADMAC dose and reduced ferric chloride dose to achieve the target zeta potential and to maximise the filter run hours during high true colour or NOM events of raw water (Fernandes et al. 2013).
Following the optimisation of primary coagulant (ferric chloride) and secondary coagulant (polyDADMAC), there was focus to optimise the coagulation aid (polyacrylamide) to further improve filter performance.
Advanced process optimisation carried out by Sydney Water identified that optimisation of non-ionic polymer (polyacrylamide) dose rate upstream of filters increases ‘floc strength’ in coagulation which improves filters performance during higher-colour raw water events (Mohiuddin et al. 2014).
For raw water true colour events of 25-30 HU @400 nm, non-ionic polymer optimisation along with optimisation of ferric chloride (primary coagulant) and polyDADMAC (secondary coagulant) doses increased the plant production rate at Nepean WFP from 140-150 L/s to 210-236 L/s, and significantly improved filters run time (Mohiuddin et al. 2014).
The raw water characterisation, filters performance data and chemicals optimisation from jar tests and pilot plant trials, were then used to develop the process model. The statistical process model developed by Sydney Water anticipates filter turbidity breakthroughs due to weak flocs and identifies the optimum chemicals dose to improve floc strength during treatment.
The developed process model was applied at Nepean WFP during October to December 2016 in high colour event for raw water true colour of 25 HU @400 nm. This successfully eliminated the filters’ turbidity breakthrough, increased plant production rate by 31%, increased all the filters run time by 60-300% and achieved significant chemical savings in the range of 20-51% (Mohiuddin et al. 2017).
The developed process model can be applied to any water filtration plant for process optimisation. The extensive jar tests, pilot plant trials and process modelling work identified the opportunity for a 20-30% increase in production capacity for higher true colour raw water from Nepean and Warragamba Dam.
Acknowledging the improvement in production capacity by raw water quality analysis and chemicals optimisation, Sydney Water carried out system wide risk assessment for all treatment and network facilities. The risk assessment identified short term improvement opportunities to reduce the treatment risk for high colour raw water. The improvement actions are managed by Sydney Water’s drinking water improvement plan.
The process capability assessment (PCA) is the study of capacity of each asset to deal with poor quality raw water due to drought break rain. The PCA summarised the treatment plant upgrade requirements to meet future drinking water demand while having drought break poor quality raw water from dam. The PCA provides input to System Blueprint.
Sydney Water’s System Blueprints map short-term and long-term system priorities (integrating treatment facilities and networks) in the context of multiple drivers. They provide a clearer picture of the long-term context and system requirements, which in turn promotes optimised investment decisions and improved customer services (Jaiswal et al. 2017). Integrated system planning investigations identified the short-term and long-term actions for WFP improvements and networks upgrades (Table 2).
Table 2: Contents of Process Capability Assessment (PCA) for WFPs and System Blueprints
Conclusion
Sydney Water’s research, study, pilot plant trials, and advanced optimisation by process modelling work significantly increased plant production rate by 20-30% from initial constrained production rate, which is an equivalent increase of 400 million litres per day production. Sydney Water also achieved 100-300% increase of filter run hours. This work saved Sydney Water over $400 million from capital projects to increase plant production by 400 million litres per day.
Sydney Water’s continued research and development, advanced process optimisation and modelling, and integrated planning will further increase the water production capacity for cost-effective drinking water supply to the expanding city.
Acknowledgment
The authors acknowledge the support and contribution of their colleagues from various departments in Sydney Water, namely Customer Delivery, Service Planning & Asset Strategy, and Integrated System Planning.
About the authors
ASM Mohiuddin | Mohiuddin is Process Manager in Customer Delivery –Production in Sydney Water. He is currently working on Drinking Water Improvement projects and leading an innovation & process optimisation team. He has 20 years of process engineering experience in petroleum, water and wastewater industries. He has a Bachelor of Science degree in Chemical Engineering and Master of Engineering degree in Water, Wastewater and Waste Engineering.
Dr Peter Cox | Peter is Sydney Water’s lead for drinking water and recycled water specifications.
He has 30 years’ experience in the water industry starting in laboratory methods development and including drinking water catchment pathogen risk management, research and development, and water quality for public health.
Ben Blayney | Ben is the Head of Water Production at Sydney Water. Ben has 30 years’ experience in water supply, treatment, operations, contracts, planning and quality management. Ben leads high performing teams to deliver safe drinking water to Sydney’s 5 million customers each day.
References
Bustamante, H.; Liu, X.; Leslie, G.; Cox, S. 2018. Maximising plant capacity – Novel instrument to measure floc strength in direct filtration water treatment plants. OzWater 2018.
Fernandes, G.; Fernando, K. 2013. Investigation into treatment of high colour & low turbidity raw water at Macarthur & Nepean Water Filtration Plants. Final Report, Sydney Water and Trility Pty Ltd.
Jaiswal, A.; Moore, C.; Wilton, M.; Healey, M. 2017. System Blueprints. WATER e-journal, Journal of Australian Water Association, Vol 2(4).
Mohiuddin, A.; Wang, Y. 2017. Statistical model development to anticipate filter breakthrough and optimise chemicals during high colour raw water events. WATER e-journal, Journal of Australian Water Association, Vol 2(4).
Mohiuddin, A.; Rajanayagam, C.; Kearney, C. 2014. Optimisation of non-ionic polymer to address production issues with high-colour low-turbidity raw water. WATER, Journal of Australian Water Association, Vol 41(8), 58-63.
Smith, A.; Mohiuddin, A; Botham, H. 2018. A Novel method for filter backwash performance assessment. WATER e-journal, Journal of Australian Water Association, Vol 3(2).
Share