K Braun, J Klaric, J Ireland.
First published in Water e-Journal Vol 5 No 4 2020.
Abstract
TRILITY has developed a production cloud data management solution, KOIOS DatalytiX to provide hybrid machine learning applications and deterministic modelling tools to its operations, asset management, and engineering teams. Two optimiser applications for chemical coagulant prediction and filtration performance were deployed in the Riverland, South Australia at 10 conventional water treatment plants in 2018, to full production in 2019. One year later the impacts on the optimisation behaviour of operations teams, process performance and trihalomethane (THM) reduction outcomes are discussed.
Introduction
The water industry has seen rapid change in recent years to innovate and manage a vast amount of operational data, while improving services and drinking water quality to millions of customers. Many technology projects quickly realise stored data is of no intrinsic value unless it is used strategically to improve performance, within a useful time horizon. For this reason, heavy focus has been put on projects aimed at implementing effective automation, data management, and fit for purpose optimisation tools, with the aim of driving the total costs of operations down and improving services to customers.
Performance evaluation and optimisation can be difficult and costly to manage when poor efficiency, lack of standardisation or aging systems become a barrier to additional improvements. Regional and remote drinking water systems can benefit from modern rapid developments in data management, modelling and augmented decision tools to supersede aging technology infrastructure.
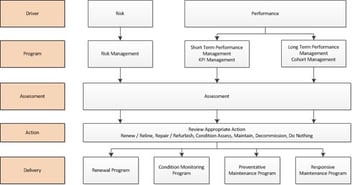
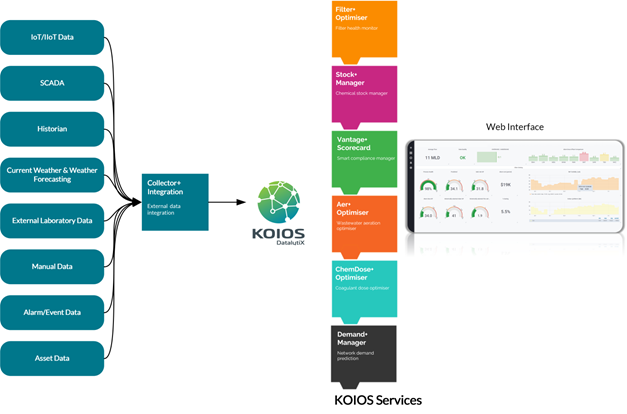
TRILITY has undertaken a multi-year first principles approach to re-align operations data management, operations technology architecture and processes. The aim is to link decision makers directly to real time performance analytics, event and notification processes, and predictive tools for optimising treatment performance (Figure 1a). Two of these tools are discussed with a focus on situational and process awareness, long term disinfection by-product formation outcomes for trihalomethane generation, and decision support tool design for operational teams.
- Predictive dosing for improved coagulation
- Automated best practice filter performance monitoring
Correctly implemented, such systems can remove or reduce the need for expensive and potentially high-risk travel, and improve process and water quality governance at either local, process or system-wide levels. It is also an opportunity to link operators to expert teams seamlessly, utilising the same digital tools, independent of their location. Understanding how individual teams, managers and support staff all interact with applications differently (“user stories”), and capturing this interaction was highly effective to build and increment useful features within the applications released to the teams.
Why change?
To build this confidence in these applications, operators must be provided sound reasons why change is required in the overall context of raw water quality, desired process performance and operating constraints. If a recommendation changes, there must be an obvious contextual relationship presented concurrently. To achieve this, the platform applications provide modern graphical interfaces, with real time SCADA, laboratory and calculated KPIs in a common environment for simultaneous viewing.
The initial two-year research and development program from 2016-2018 developed required data infrastructure and components to scale the service into production. The chemical dosing optimiser was then deployed in early 2019, and the filter optimiser in early 2020. The applications development team was formed to provide optimisation solutions as a service to the business, with training, platform, and web portal management support. Providing user feedback sessions and performance benchmarking were critical for trust building and successful long-term implementation after each production deployment.
To enable process predictions to benefit performance, operators must be able to see clear reasons to change. Many chemical dose predictors and asset performance engines are commercially available. However, to ensure uptake, optimisation applications must be backed up by strong evidence for those controlling processes to make an informed change with confidence.
Figure 1a. KOIOS DatalytiX Platform architecture for process optimisation applications.
General application goals
Applications for the platform were built by understanding key operational pain points in water and wastewater treatment, interviewing operational teams and completing several proof-of-concept studies. This was to ensure each module provided clear benefits to performance, automation or workflows enhancements on delivery.
For the development of each model or application, the business requirements, data quality and operational context to the problem under investigation needed to be well understood. Specific aspects of each data set, and the methodology required for different modelling approaches and tools were only investigated once a detailed business understanding was defined (Figure 1b).
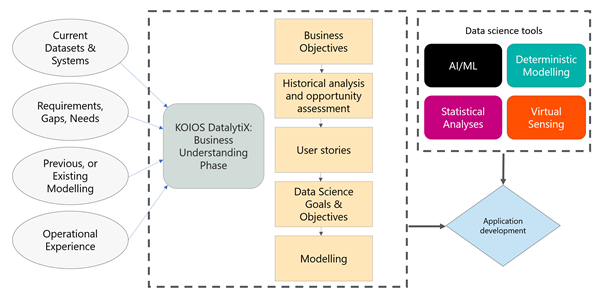 Figure 1b. Business understanding process for application development.
To ensure value in each application was delivered, the following generalised application goals were established to guide the development teams during each phase.
- Goal 1: Consolidate – To unify data management and automation benefits with a scalable and operator-focused solution across operations, asset management and water quality teams. This ensures multidisciplinary intelligence & experience is captured as user stories in the application design process.
- Goal 2: Simplify – Improve and streamline optimisation tasks and processes while codifying long-term operational knowledge into applications. Make the task easier than the process being superseded. Complexity should be removed where practical with core focus on specific operating context for each user story.
- Goal 3: Benchmark – Ensure benchmarking and assessment of long-term process performance uses a data driven approach to minimise risk, while being transparent and traceable.
- Goal 4: Improve – Ensure we can quantitatively demonstrate improved customer, compliance or OPEX outcomes for each application deployed into operations.
Application deployment in the Riverland Contract, South Australia
In this case study, production deployment of two of the platform applications, ChemDose+, Filter+ and subsequent performance and capability outcomes are discussed. The Riverland contract was selected for this analysis as it is unique in that the catchment source, raw water quality and treatment design similarities allow broad benchmarking comparisons across multiple sites.
The Riverland contract, operated on behalf of the local water utility, is in regional South Australia and consists of 10 water treatment plants located from Renmark on the Murray River near the Victorian border to Summit storage in the outer metropolitan area of the Adelaide Hills (Figure 2). The WTPs vary in production capacity from 4 megalitres per day (ML/d) at Waikerie to 90ML/d at Swan Reach. During the project the following activities and application deployments were undertaken.
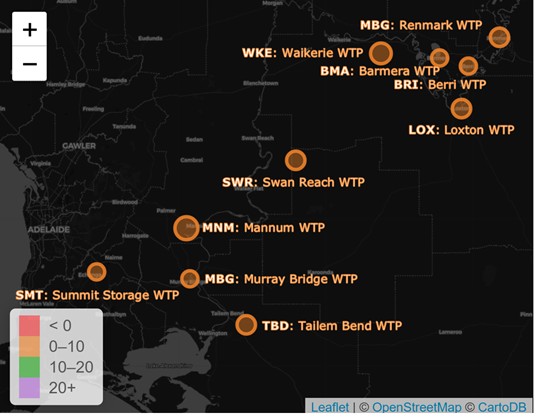 Figure 2. A snapshot from the operational system showing the location of the 10 Riverland conventional WTPs in regional South Australia.
These application goals were developed into a series of requirements and managed from design through to implementation and training by a team of subject matter experts from water quality, process, data engineering, data science and asset management teams.
In addition to the above stated goals, the COVID-19 pandemic has clearly demonstrated the need for additional flexibility in regional operations - when less experienced operational teams are potentially isolated for long periods by necessity from managers, senior operators or team leaders. In this context, it is critical that data management solutions and optimisation applications be scalable, easily supported, and robust during potentially extended periods of adverse operations.
- Migration, data modelling and loading of over 7,000,000,000 historical data points into a common data store, connected securely to SCADA, ERP and third-party databases.
- Automated high and low volume data ingestion workflows to enable machine learning, deterministic and hybrid modelling output capability as well as custom data views by user story.
- Chemical coagulant dose prediction and historical hindsight engine for water quality performance assessment and model output validation.
- Applications for rapid filter asset performance assessment including coagulation performance validation tools.
- An in-house unified, modern and flexible web-based user experience (UX) and user interface (UI) with no external vendor support required for dashboard design and visualisation.
The data brought into the KOIOS DatalytiX platform, and the frequency of the datapoints received from these sources, ranges from quasi-static, such as site information, to daily, hourly, minutely and even sub-second for on-line SCADA sensors depending on the site and process.
In order to allow for analyses at multiple timescales, data is sent and stored in a raw, immutable format and then processed as needed for dependent calculations, virtual sensors, and aggregations required by operators. Irregularities or missing data can be quickly computed on-line and brought to the relevant stakeholders’ attention.
Methodology
To assess long-term optimisation outcomes, four discrete historical periods of operation were comparatively assessed over a 17-year period from the beginning of available water quality data at each WTP. The final discrete historical period is divided into two subsets before and after optimisation applications, to understand the benefits of the ChemDose+ and Filter+ applications. Each discrete period has been selected to allow like-versus-like comparisons of operation between comparable periods. In our results and discussion, we compare the millennium drought to recent drought conditions impacting NSW, Victoria and South Australia, while comparing the blackwater events described with each other, and finally performance as a whole.
Period A: Millennium drought: 6/01/2004 – 31/01/2010
This period of operation took place during the millennium drought in South Australia, commencing with low rainfall in 1996 and recognised by 2003 as the worst drought on record. Water quality in the Murray Darling Basin (MDB) for this period was characterised by low turbidity and low dissolved organic carbon loading with low raw water variability. This period ended abruptly in late 2009 with large inflows to the catchment with the La Nina weather events resulting in widespread rain and flooding in Queensland and South Eastern Australia. (Braun et al 2013)
Period B: Blackwater 1: 31/01/2010 – 2/07/2016
The first blackwater event from drought breaking rains in late 2009 resulted in raw water quality degradation, and extreme treatment challenges with dissolved organic carbon (DOC) peaking at >18mg/L and associated peak turbidity events >400 NTU.
Period C: Blackwater 2: 2/07/2016 – 5/04/2018
The second extreme weather event resulting in unprecedented treatment challenges occurred in 2016 with large inflows to the MDB, with peak DOC >25mg/L and peak turbidity of >180NTU (Figure 3).
Period D: South-eastern (SE) drought: 5/04/2018 – Present
This period marked a return to stable raw water quality in the catchment seen during the millennium drought. This period is discussed in relation to the millennium drought to compare similar periods of catchment quality.
Building trust
Perhaps the most important focus of deploying production optimisation systems and applications to operators is confidence that the model output is providing a valid output and an optimised selection based on plant history, current raw water quality, and hydraulic conditions.
To build trust in the solution and lay the groundwork for future modules in the original 2019 deployment, operators were shown how the model outputs varied over long time scales, with water quality and other performance indicators, including extreme events and high production demand periods. Once this had been demonstrated, further training focused on how the applications could be used for operational decision making.
This way it could be demonstrated that operational knowledge generated by their historical decision making formed a cornerstone of the current predicted or recommended values, further enhancing trust in the platform.
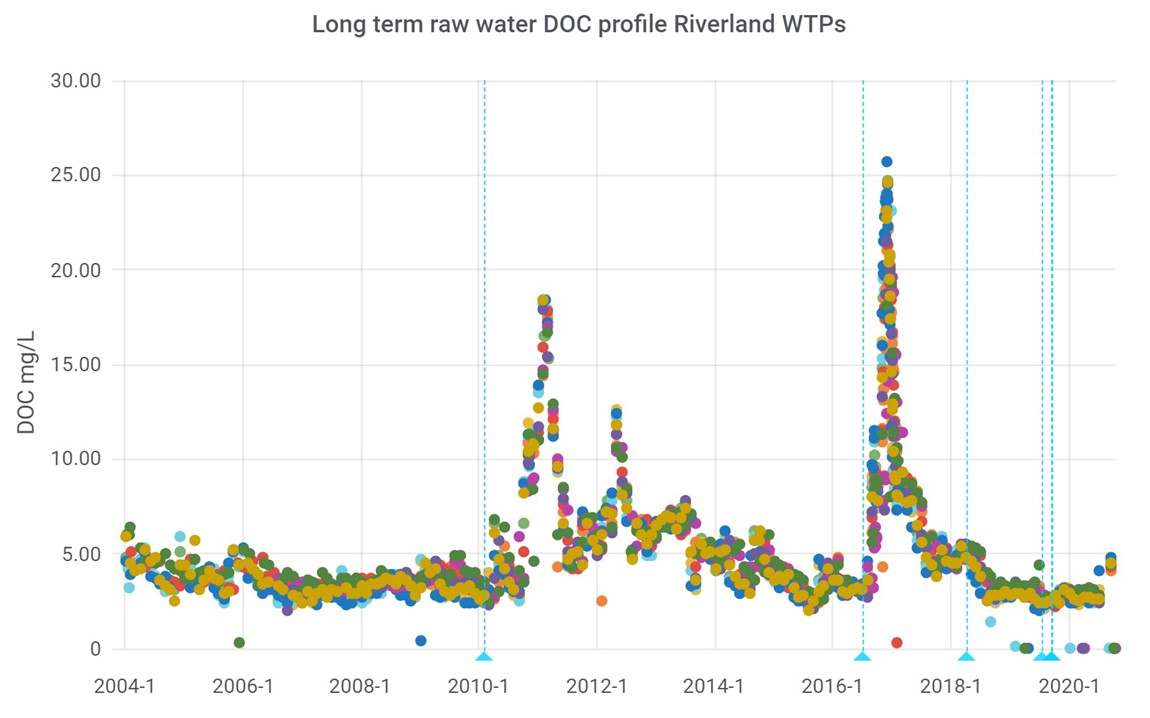 Figure 3. An extract of the operational platform showing long-term historical dissolved organic carbon concentrations as a pre-cursor to THM production. The different coloured dots represent the different sites along the Riverland series of plants.
Coagulant dose prediction
Historically coagulant dose optimisers have been utilised to predict dosage rates online with accuracy (Mussared et al 2014), however, the integrated platform, computational power and data management tools required to streamline and scale these tools are only just becoming widespread in water operations. The ChemDose+ application is utilised for coagulant dose prediction and has been in production at the Riverland contract from mid-2019. The solution uses a machine learning algorithm and historical decision tracking to create an ensemble model for each of the 10 WTPs, providing high and low confidence predictions for alum dose automatically as water quality changes recommending a safe average prediction. The confidence band is displayed in purple, with the yellow trace representing the dose prediction and the green line representing operator setpoint selection (Figure 4 and 5).
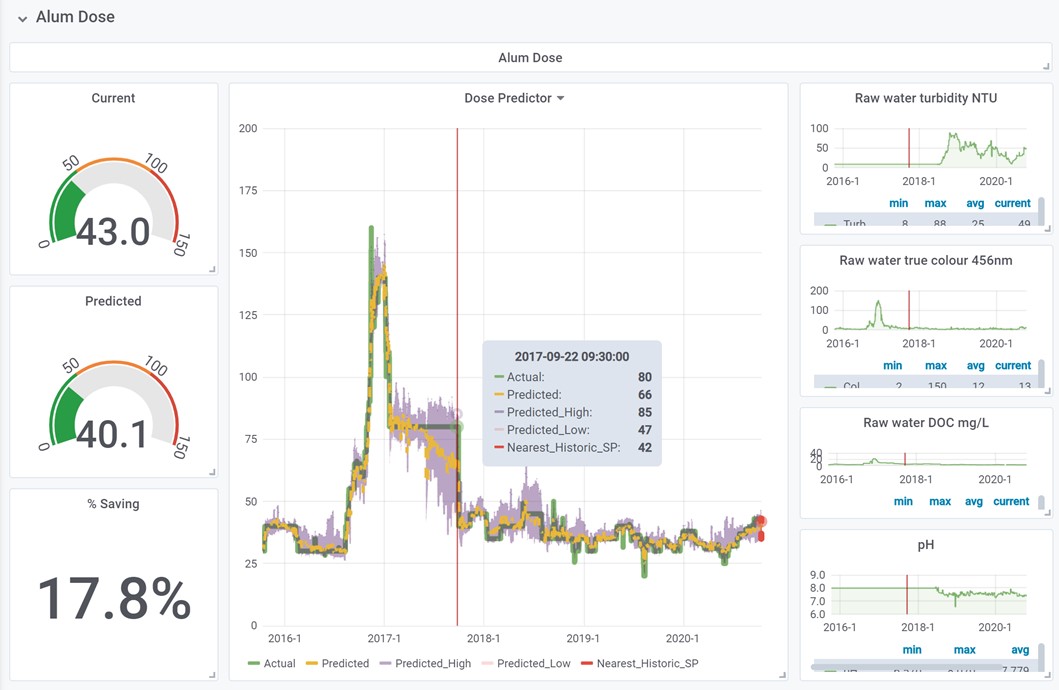 Figure 4. ChemDose+ trend of coagulant dose prediction vs actual for alum.
To understand in more detail the impact of providing these tools, the system was deployed in production in 2019. Performance was monitored over a twelve-month period for trends in operator behaviours, number of optimisation events, and convergence (if any) of operator dose selection with application predictions.
Once deployed the ChemDose+ implementation was applied retrospectively to all 10 WTPs to identify areas where chemical dosing optimisation may be improved in future and to assess the potential for OPEX savings associated with more frequent and responsive setpoint change.
Management assessment and gamification
To ensure the optimisation strategy was aligned with operations managers, detailed overviews of all operating plants are displayed for comparison and assessment. Providing clear performance analytics (Figure 5) allows team leaders and operations managers to benchmark performance in real-time. The process can then be ‘gamified’ where operators can compare each other’s sites with the goal of operating the most performant and efficient plant. A relative offset indicator provides teams and operations managers current state performance (Figure 6).
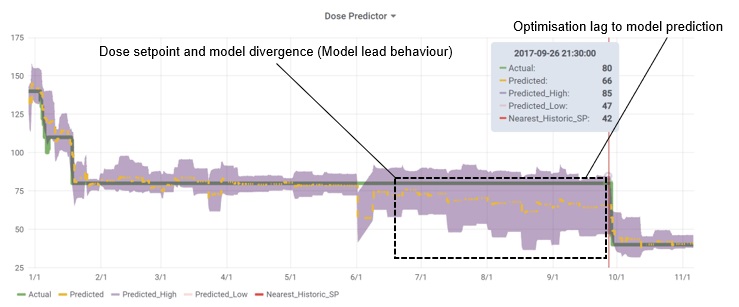 Figure 5. A snapshot of a year of predictions showing how the ChemDose+ model leads behaviour as raw water quality improves.
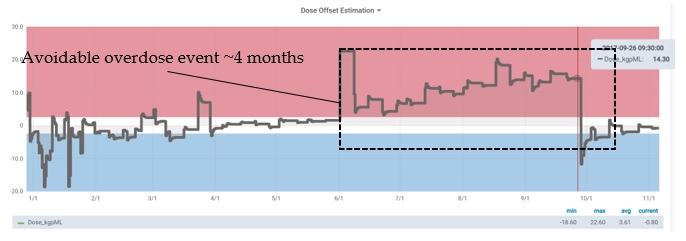 Figure 6. A snapshot from showing historical model offsets (predicted vs actual dose rates difference in mg/L).
Sites that are out of step by a large percentage with predicted values are not required to change immediately. However, they are prompted to assess their current optimisation for potential improvement. To understand if this strategy would be effective, TRILITY analysed the number of optimisation changes undertaken during the period twelve months after ChemDose+ was deployed with the immediately preceding twelve-month period for comparison.
Optimisation frequency by site
The frequency of setpoint change saw significant change post implementation with an average 56% increase in operational changes to alum dose rates (Figure 7). This increase was consistent across all 10 WTPs. When viewed in the context of historical performance, optimisation was found to be increased with more minor water quality changes than previous periods, with shorter reaction times after raw water quality change (data not shown). Interviews with process support teams indicated rapid uptake was apparent for many operators who were using Chemdose+ to augment dose optimisation activities between regular jar testing duties.
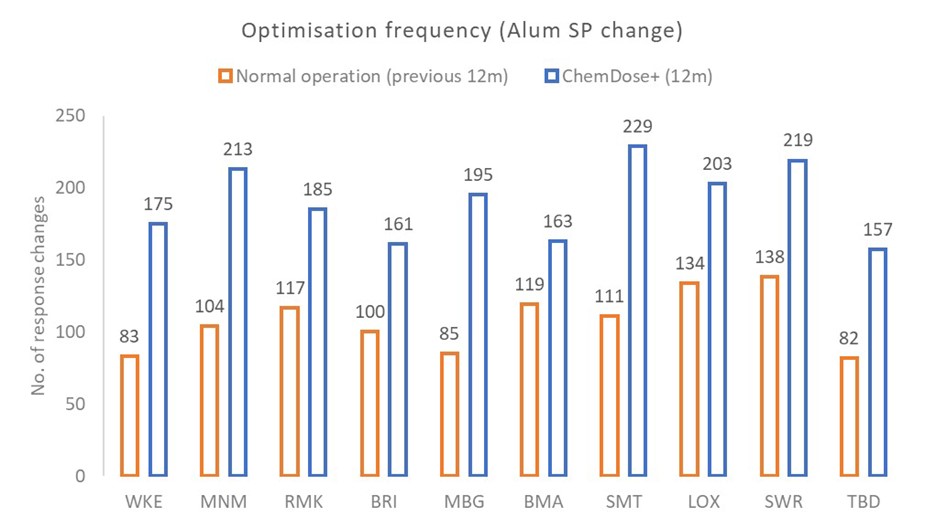 Figure 7. Increase in alum dose rate changes by operational teams.
Automated filter health monitoring
To offer confidence the ChemDose+ applications provide due benefits with no appreciable degradation in plant performance or water quality, the Filter+ application was utilised to assess calculated end-of-run turbidity performance, by capturing and aggregating the last known turbidity value prior to backwashing. This assessment provides confidence as the operations team utilise the predicted ChemDose+ setpoint more frequently, and ensures no aberrant performance or conditions are generated that would compromise operations or treated water quality.
The second focus of the Filter+ application was to benchmark normalised clean bed head loss (NCBHL) for individual filters and normalised head loss accumulation rate (NHLAR). These indicators provide a rapid assessment of short and long-term filter asset performance and allow individual filters to be compared to each other independent of flow variation or size between WTPs. These assessments can be used to accurately inform asset and project teams of potentially underperforming assets and prioritise media top-ups, cleaning, and inspection regimes.
Long-term filtration performance analysis can be a difficult task to analyse and interpret, even for the most experienced process engineer. Very large data sets can rapidly cripple local data management tools and require engineering teams to sort, analyse, validate, compare and infer performance inefficiently, requiring complete re-analysis when the next performance period is required.
To remove the need for infrequent and manual calculation and assessment, and to align TRILITY operations to the current Water Service Association Australia (WSAA) ‘Good Practice Guide to the Management of Microbial Risk’ manual for its media filtration assets, the application was designed to automate multiple filtration KPIs for at-a-glance current state and long-term performance analysis.
Normalised clean bed head loss (NCBHL)
The normalised clean bed head loss metric is designed to monitor filter media state and is normalised for flow and surface area to a unit of mwg/(m2)/(kl/s) → mwg/(m/s) (meters water gauge/meters per second through the bed).
This metric is dependent on the filter media characteristics (media size, porosity, media depth, media roundness etc.) and so provides an insight to the filtration asset state.
A sudden reduction in clean bed head loss may infer:
- Loss of filtration media due to incorrect backwash function
- Improper flow distribution (reduced supply) between filters
- DP cell calibration errors
A sudden increase in a single filter clean bed head loss may infer:
- Improper flow distribution (excess supply) between filters
- Poor backwash efficiency (possible failure of backwash equipment)
- DP cell calibration errors
A slow increase in all filters clean bed head loss may infer:
- Poor backwash efficiency (insufficient aeration, flow rates or times in wash states) under the current raw water quality conditions
A slow reduction in clean bed head loss may infer:
- Media recovery after excess solids loading event
- Loss of filtration media through poor backwash control
The clean bed head loss metric is specific to a filtration asset state and provides an early indicator of state changes which require review before media loss or mud balling events become unrecoverable.
Normalised head loss accumulation rate
The normalised head loss accumulation rate metric is designed to monitor the tendency of the feed water to foul the filter bed. The NHAR is normalised for flow, surface area and volume of water processed.
This metric is dependent on the filter media characteristics (media size, porosity, media depth, media roundness etc.) and feed water solids loading.
A sudden increase or decrease in a single filter normalised head loss accumulation rate may infer:
- Improper flow distribution (excess or throttled supply) between filters
- Improper floc distribution in the filter manifolds (direct filtration)
- DP cell calibration errors
An increase in all filters normalised head loss accumulation rate may infer:
- Worsening of raw water quality
- Degradation of upstream clarifier performance (Improper chemical dosing or hydraulic overloading)
The normalised head loss accumulation rate metric is usually specific to a filtration asset’s feed water state, and provides an early indicator of state changes, which require review before treated water quality is affected and especially highlights ineffective coagulation control.
OPEX assessment
Ensemble models were generated and included in the ChemDose+ application to allow historical modelling of potential chemical savings by safely minimising dose rates. Predicted low values provide a safe operating context to minimise chemical dose during stable low risk periods. Predicted high values provide the facility to move towards enhanced coagulation practice for DOC removal, without the risk of unnecessary overdosing and process degradation.
Results
Variance between dosing predictions and operator setpoint selection
Figure 8 shows the offset of predicted alum dose from the current setpoint selected by the operator, prior to deployment in 2019 (n=6908) and post deployment to the present (n=6918). Prior to deployment there is significant variance in dosing offset to the predicted optimal dose. After application deployment in June 2019, the data demonstrates a smoothing toward equilibrium with the model output (smaller offsets). This is to be expected when increased usage and willingness to accept the application predictions occur. A tightening of the variability and min/max offsets over the period also indicate increased use and reliance on the platform for process guidance.
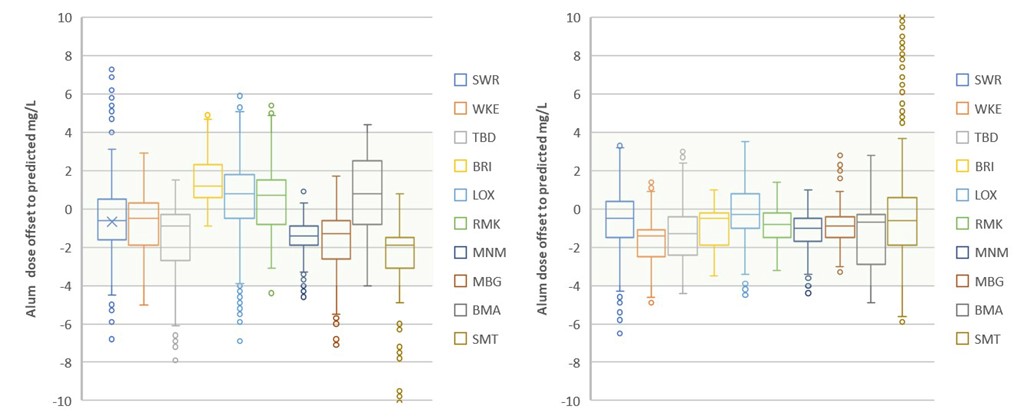 Figure 8. Flattening to model equilibrium of operator selected setpoint post ChemDose+ deployment. Circles represent possible outlier events (>1.5x interquartile range from the median)
ChemDose+ OPEX performance
Ensemble modelling provides a confidence range to predicted values when using the ChemDose+ application. This provides users a safe minimum dose rate selection if operators seek to reduce the chemical costs of coagulants. Model fitting was retrospectively applied to all ten WTPs to gauge chemical reductions using the Predicted low parameter for alum dose rate over a seven-year period. The differential between the setpoint applied and this value was calculated to show potential reductions available for the period (Table 1).
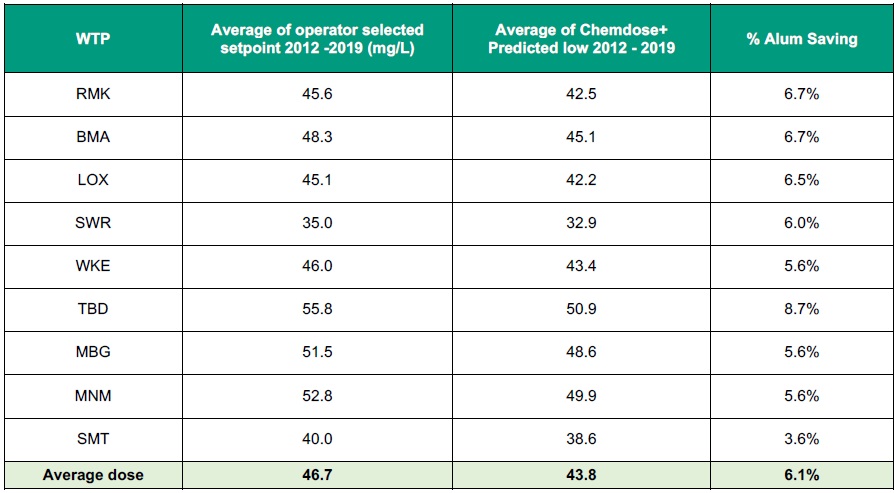 Table1: OPEX chemical savings potential for alum.
THM performance 2004 – 2020
THM performance for the Riverland contract has steadily improved in relation to comparable water quality periods (Figure 9). Long-term trends show performance increase when comparing high organic loading periods (B,C) and stable low organic, low turbidity periods (A,D).
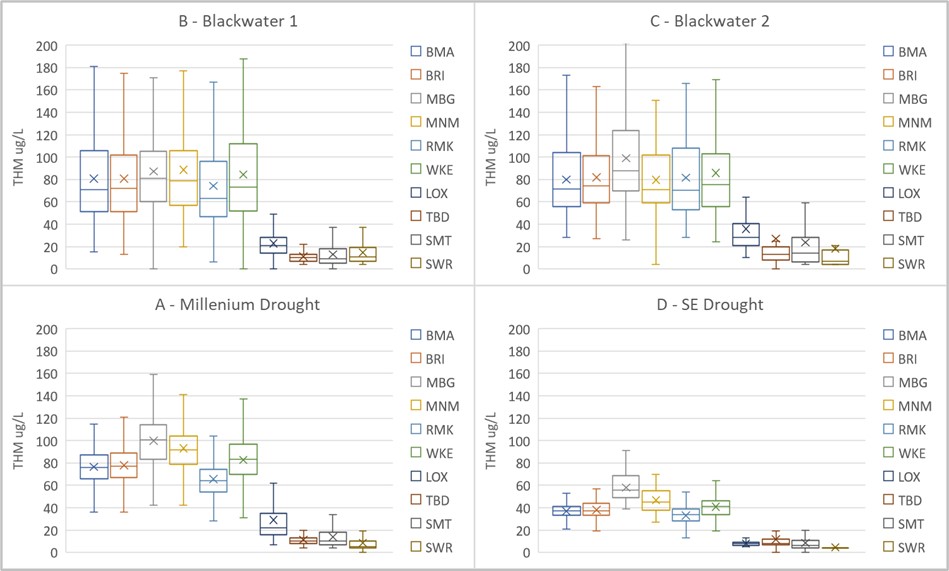 Figure 9. Seventeen-year THM performance evaluation for Riverland WTPs.
When assessing percentage reductions between periods A and D, a large increase in overall THM production in treated waters was observed at both chlorinated (WKE, RMK, MNM, MBG, BRI, BMA) and chloraminated (TBD, SWR, SMT, LOX) sites. This indicated broad optimisation taking place over time with an average reduction of 46% between the periods (Figures 9 and 10), where n=18,708 samples.
Figure 10 shows the broad mean reduction between periods A-D. High organic loads are often precursors to elevated THM formation potential, with removal through coagulation and sedimentation leading to improved THM performance. Between periods A – D, True colour removal @ 456nm increased an average of 7% (data not shown) with increased coagulation optimisation occurring in period D, leading to an overall reduction of THMs in treated water. Both chlorinated and chloraminated sites benefited from this improvement, indicating that lower formation potentials present for chloraminated sites can also benefit substantially from this optimisation (Figure 9 and 10).
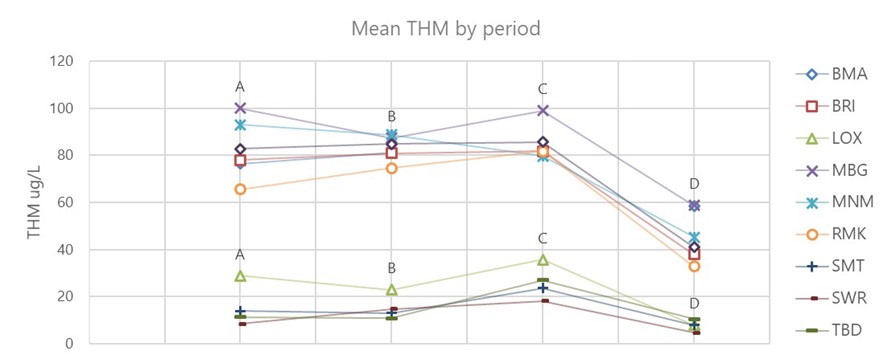 Figure 10. Mean THM ug/L by period A -D.
These gains are particularly impressive considering True colour in the raw water increased by more than 25% on average for period compared to A (data not shown), indicating greatly increased coagulation effectiveness when comparing the two periods.
Maximum THM values for the two periods were reduced significantly, with Max THMs reduced by up to 84% at some sites, ensuring compliance well below the regulated 250ug/L in the Australian drinking water guidelines (ADWG, 2011).
When assessing percentage reductions between periods A and D, a large increase in overall THM production in treated waters was observed at both chlorinated (WKE, RMK, MNM, MBG, BRI, BMA) and chloraminated (TBD, SWR, SMT, LOX) sites. This indicated broad optimisation taking place over time with an average reduction of 46% between the periods (Figure 11), where n=18,708 samples.
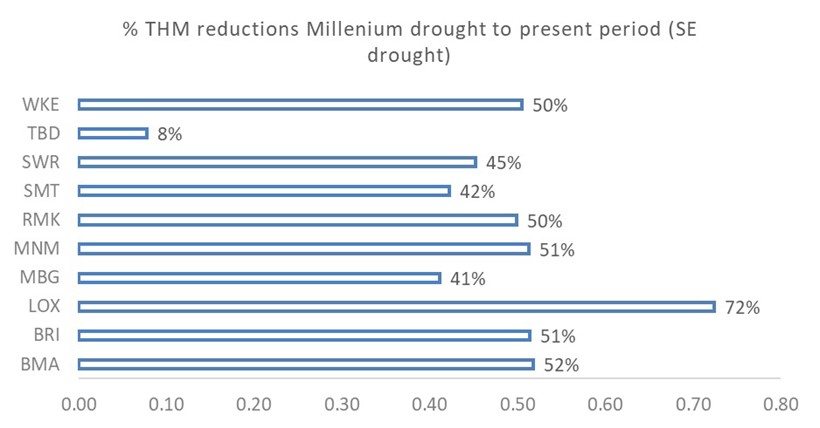 Figure 11. %THM reduction in treated waters during the millennium drought (A) when compared to the SE drought period (D).
NCBHL NHLAR performance
A single plant (LOX) is discussed here in the context that no fundamental increases in water quality decay in treated water were observed over the two-year time period represented, contrary to what was seen in the filter performance at the other nine WTPs. Using this tool, water quality and process support teams were able to identify and co-ordinate with operations teams to prioritise filter media replacement and inspections at this location.
NCBHL performance for LOX showed clear performance degradation for filter one with values >50% higher than the nearest filter (Figure 12), flagging this filter for assessment and maintenance inspections.
Real-time, end-of-run turbidity showed no degradation in performance (data not shown) of f
ilter one, indicating degrading filter performance may be an invisible process when standard water quality metrics are applied to benchmark their performance. Three additional filters across the 10 WTPs have been flagged for further media replacement prioritisation and enhanced inspections.
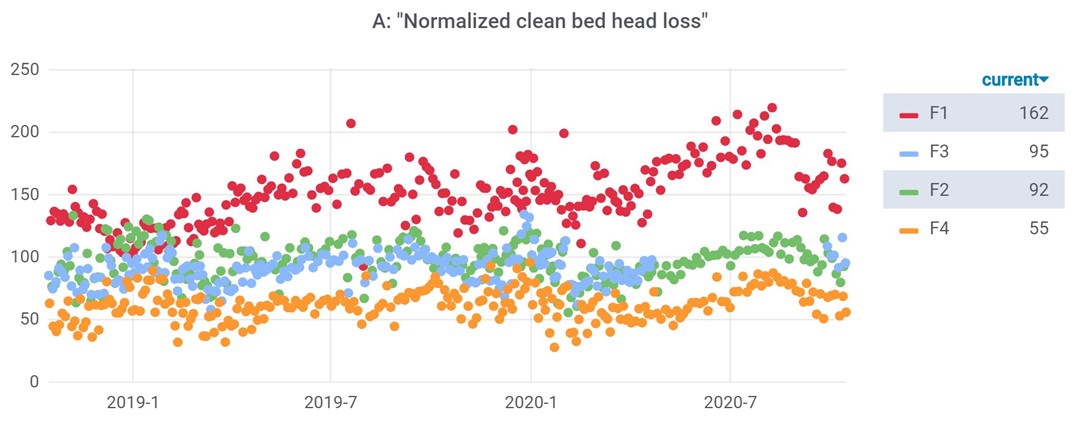 Figure 12. LOX WTP real time NCBHL over a two-year period.
Discussion
A major benefit of the change in behaviour observed when deploying these applications was the vast improvements in process visibility and optimisation practice at site level, without relying on engineering or process specialists to engage with site (particularly of notable benefit during COVID-19 restrictions). Deploying at scale provided a standard process and tool set, allowing multiple sites to achieve the same, clear performance benefits when utilising the two applications in conjunction.
THM reductions observed were significant by implementing these changes and upgrades to current practice. Depending on the driver, these tools can be utilised to streamline performance increases in water quality OPEX or optimisation behaviours, depending on the focus of operational teams to meet new realities of remote work, regulated water quality, and value provided back to utilities end users.
The large reduction in data manipulation and assessment often required by subject matter experts, engineers or site teams is not discussed in this paper, however, this intangible efficiency gain, frees expertise in water utilities to provide higher value services to operational teams.
While optimisation goals are different for many utilities’, validation and confidence in predictive analytics is a common theme, this trust gap must be bridged if success is to be achieved embedding AI and other next generation technologies.
The deployed tools demonstrate that predictive models can be deployed at scale, made simple to use, and provide immediate benefits to treated water performance and efficiency. Performance goals can be automated and tracked, with measurable improvement even during complex operating conditions. In addition to the automated AI-powered optimisation, the true success of any system requires the appropriate management of human factors. This may include adequate training of operations teams, and effective continuous improvement strategies, and clear explainable goals to users and stakeholders across the business.
About the authors
Kalan Braun | Business manager, Data analytics
Kalan Braun has previously worked with Australian water utilities in water treatment, process, water quality and operations management roles, including four years with TRILITY as water quality manager in the operations leadership team. Kalan’s focus has centred on operations performance improvement, regulatory risk mitigation and strategic business development for operations.
James Ireland | Head of Product Development
James Ireland has 10 years’ experience in the Australian water sector in commissioning and control systems for treatment operations, process modelling for the delivery of advanced process control solutions and recently architecting the integrated TRILITY KOIOS Datalytix platform to enable TRILITY’s digital transformation.
Jonathan Klaric | Operations data scientist
Jonathan Klaric has a background in theoretical physics and mathematics, with experience as a mathematician and numerical engine developer for major water modelling software providers. Jonathan is one of KOIOS DatalytiX operations data scientists and has a role as the resident scientist at UQ’s wonder of science program.
References
National health and medical research council (NHMRC), Australian Drinking Water Guidelines (2011) - Updated May 2019.
Braun, K, Fabris, R, Morran, J, Ho, L, Drikas, M. Drought to flood: A comparative assessment of four parallel surface water treatments during the 2010–2012 inflows to the Murray–Darling Basin, South Australia. Science of the Total Environment 488–489 (2014) 36–45
Mussared, A. implementation of predictive alum dose control systems, 77th Annual WIOA Victorian Water Industry Operations Conference and Exhibition Bendigo, 2014.
Water services association of Australia (WSAA), Research Project 1117, Good Practice Guide to the Operation of Drinking Water Supply Systems for the Management of Microbial Risk. Second Edition, 2020.
Share