


Q Bechet, X Philoleau, M Mellado-Ruiz, A Siqueira, M Aguilar.
First published in Water e-Journal Vol 5 No 3 2020.
Abstract
Inspection and condition assessments of network infrastructure are critical for water utilities and city councils to ensure the structural integrity and functionality of sewer pipes and stormwater drains. These assessments are necessary to identify the pipes requiring rehabilitation before they deteriorate past the point of renewal. In practice, these assessments are performed manually through camera inspection of the pipes. However, the visual observation of the resulting footage can be biased by the operator subjectivity.
VAPAR.Solutions is a cloud platform that automates condition assessment directly from a pipe’s CCTV footage. In this context, VAPAR, an Australian-based company, developed a deep-learning algorithm to code inspection videos automatically and consistently. This study aimed to evaluate the performance of this auto-coding algorithm by using a dataset of 203 inspection videos captured in stormwater and sewer pipes in Victoria, Australia.
This study revealed that the VAPAR algorithm missed fewer defects in sewer and stormwater pipes (13.2%) than the operator during visual inspection (36.6%). The VAPAR algorithm was, however, ‘over-sensitive’ and generated 28.1% of false alarms, against 7.8% for the operator.
This study also revealed that the VAPAR algorithm was significantly more accurate than the operator at grading the pipes, with an accuracy between 76.3-79.8% against 48.5-52.2% for the operator.
Because maintenance and rehabilitation programs are typically based on these service and structural grades, the use of the VAPAR algorithm could help better identify assets that require cleaning or rehabilitation.
Introduction
Inspection and condition assessments of network infrastructure are critical for water utilities and city councils to ensure structural integrity and functionality of sewer pipes and stormwater drains. These assessments are necessary to identify the pipes requiring rehabilitation before they deteriorate past the point of renewal.
The Australasian Corrosion Association estimated in 2014 that corrosion caused mains failure costing approximately $900 million per year. For this reason, water utilities and city councils across Australia spend millions of dollars every year to maintain their sewer and stormwater assets.
The traditional CCTV condition assessment methodology of network assets presents challenges for utilities and operators, such as:
- the time required to visually review CCTV inspection videos and identify defects;
- the operator subjectivity (Dirksen et al., 2013); and
- the field conditions which can make the visual inspection practically difficult.
To address these issues, the recent deployment of artificial intelligence tools has allowed the development of algorithms to automatically identify defects from inspection footage. VAPAR developed an algorithm to automatically code inspection videos using deep learning.
While visual recognition algorithms have been used widely in various industries, this specific application is relatively recent and needs to be rigorously tested. One of the specific challenges faced during the validation of such algorithms is the subjectivity of the labelled data.
For example, Dirksen et al. (2013) showed that the probability of false positive is in the order of 25%. In other words, approximately 25% of defects are typically missed by operators. In this context, the operator assessment cannot be used as a reference to assess the performance of auto-coding solutions.
This study developed a rigorous process to assess the accuracy of such auto-coding algorithms relying on the detailed review from an experienced operator to construct a reference list of defects. The objective of this study was to apply a similar strategy to evaluate the performance of the VAPAR algorithm.
Methodology
Pipe selection
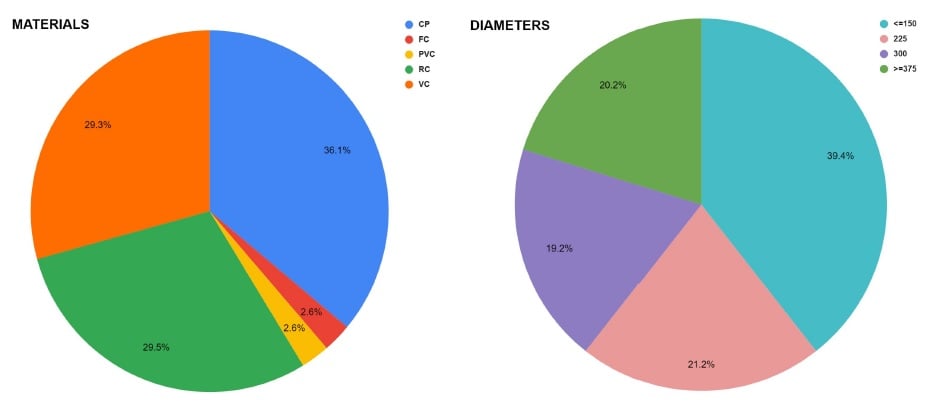
The CCTV videos used for this trial were selected from various inspection campaigns performed by Veolia Network Services in Victoria, covering a wide range of diameters and materials (see Figure 1 for details). A total of 203 pipes were included in this study, representing a total length of 3594 m.
Figure 1: Repartition of diameters and materials in the 203 pipes used for the comparison of VAPAR results against operator observations (normalised by length; Total length of 3594 m; CP: Concrete pipe; VC: Vitrified clay; RC: Reinforced concrete; PVC: Polyvinyl chloride; FC: Fibre Cement; Diameters in mm).
VAPAR algorithm
The VAPAR algorithm is based on a deep-learning approach. The algorithm was calibrated on an extensive dataset to allow the recognition of a large range of defects. The algorithm provides a score for each identified defect ranging from 1 (minor) to 165 (major) according to the WSA 05-2013 Conduit Inspection Reporting Code of Australia (WSA 05) (Water Services Association of Australia, 2013).
For each video, the algorithm analyses key frames and locates the recognised defects (if any) at the chainage displayed on the video.
Defect classification
In order to facilitate the comparison between VAPAR results and operator observations, the 77 different WSA 05 defect types that were reported by the VAPAR algorithm were summarised and classified in six different categories:
- cracks;
- roots;
- obstructions;
- joint defects;
- connection defects; and
- other.
In the following, the accuracy scores are provided within these six categories.
Comparison process
The following process was used to compare VAPAR results against the operator observations:
- The operator observations were retrieved from the Wincan mdb files.
- The results from the VAPAR analysis were extracted from VAPAR’s web portal.
- The two results were compared, and a listing of all differences was extracted, including cases where:
- The type of defects differed between the VAPAR analysis and the operator observations (e.g. ‘roots’ vs. ‘cracks’)
- VAPAR identified a defect where the operator did not report any defect, or the contrary.
- Video frames were extracted for each listed difference and an independent operator reviewed them manually through a web application developed specifically for this purpose.
This process allowed the construction of a ‘reference’ used for the comparison of results. The VAPAR results and operator observations were both compared against the reference.
Metrics
Sometimes the chainages reported by the operator and VAPAR for the same defect differed by up to 0.5 m due to the identification process. Because of this 0.5 m difference, the comparison was made on a ‘section-by-section’ basis.
In practice, each inspected pipe was segmented in 1 m-long sections. If both VAPAR and the reference had a defect of the same nature in the same section, then these defects were assumed to be the same ones and the VAPAR assessment for this section was considered as correct (see Figure 2 for an illustration).
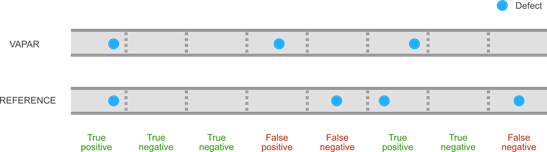 Figure 2: Top: location of defects as identified through the VAPAR analysis; Bottom: List of defects in the reference. In this example, the pipe contains eight 1m-long sections.
This process was repeated for each inspected pipe and the following indicators were calculated to estimate the performance of the VAPAR analysis and the operator observations against the reference. Two indicators were used in practice:
- Precision: A precision of 80% means that 80% of the 1 m-long sections identified by VAPAR as having a defect indeed had at least one defect. Conversely, this means that 20% of the sections identified by VAPAR as defective were in good condition.
- Recall: A recall of 70% means that the VAPAR algorithm was able to identify 70% of the defective 1 m-long sections but missed 30% of them.
An ideal algorithm would, therefore, have 100% precision and 100% recall.
In this analysis, these indicators were calculated to assess the performance of both VAPAR analysis and the operator observations against the reference. These indicators were calculated for each of the six categories of defects listed in the above subsection.
Service & structural grades
For each video, both the service grade and the structural grades were estimated through three different techniques:
- Operators visually estimated these grades during the initial inspection.
- VAPAR calculated these grades from the defects that were identified and by using the WSA 05 standard guidelines.
- The grades were also calculated from the list of defects of the reference by also using the WSA 05 standard guidelines.
The operator and VAPAR grades were compared against the reference grades.
Results & discussions
Overall VAPAR performance
Figure 3 shows the precision and recall of the VAPAR analysis for the six categories of defects when compared against the reference.
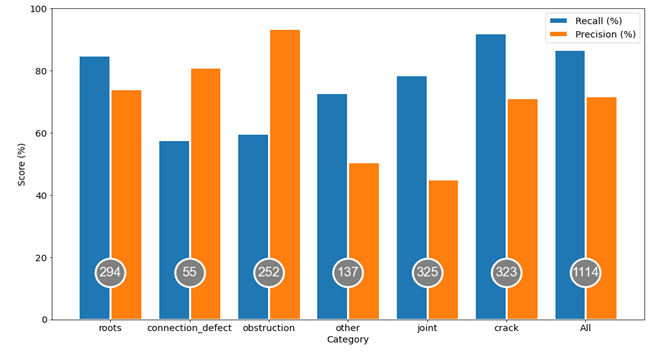 Figure 3: Recall and precision obtained for the six categories of defects; the number in the grey circle represents the number of defects in the reference for each category.
The last two bars of Figure 3 (‘All’) show the performance of the VAPAR analysis irrespective of the type of identified defect. The recall of 86.8% of defects for this ‘All’ category shows that VAPAR correctly identified as defective 86.8% of the 1 m-long sections that had a defect.
The overall precision of the VAPAR analysis was 71.8% when combining all categories of defect. In other words, 28.2% of the 1 m-long sections identified by VAPAR as defective had no defect. This shows that the VAPAR analysis is slightly over-sensitive to defects.
The detailed analysis below reviews the performance of the VAPAR analysis for each category of defect.
VAPAR performance — roots
The relatively high recall (84.8%) and precision (74.2%) for roots show that this type of defect can be easily identified by the VAPAR algorithm. Figure 4 shows that 14.5% of the defects identified by VAPAR were not actual defects, and that most of these defects had a score of 1, i.e. defects that were identified as micro-defects.
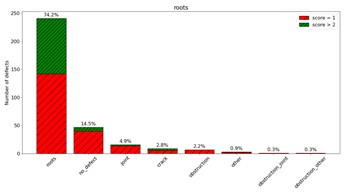 Figure 4: Repartition of the defects identified as VAPAR by ‘roots’. 71.6% of these defects were actually roots; 14.5% were not defects, etc. The colour represents the fraction of micro defects (red; score of 1) and bigger defects (green, score above 2).
VAPAR performance — connection defects
While the VAPAR precision is satisfying for connection defects (81.1%), the recall was relatively low (57.7%). In particular, Figure 5 shows that VAPAR missed 28.8% of the connection defects and that VAPAR misdiagnosed 13.5% of actual connection defects for defects of other categories. These results were based on a total number of 55 actual connection defects, which may limit the validity of this conclusion.
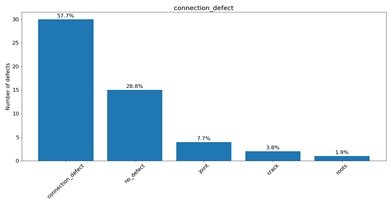 Figure 5: Repartition of the actual category of defects for the 1 m-long pipe sections identified by VAPAR algorithm as having a ‘connection defect’.
VAPAR performance — obstructions
Like the connection defects, the precision of the VAPAR analysis was relatively high (93.5%) but the recall was relatively low (59.8%). Figure 6 shows that the VAPAR algorithm missed 22.0% of the obstruction defects and that 18.2% of the actual connection defects were misclassified for defects from another category.
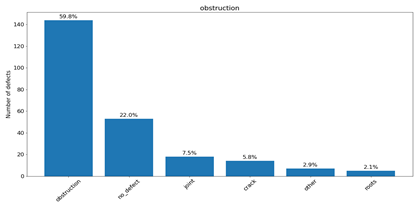 Figure 6: Repartition of the actual category of defects for the 1m-long pipe sections identified by VAPAR algorithm as having an obstruction.
VAPAR performance — joint defects
While the recall of the VAPAR analysis is satisfying for joint defects (78.6%), the precision is relatively low (45.2%). This low precision means that 54.8% of the joint defects identified by VAPAR were actually not defects.
Figure 7 shows that 39.1% of joint defects identified by VAPAR were rejected by the independent reviewer. However, Figure 6 also shows that the large majority of these rejected defects were identified by VAPAR as ‘micro-defects’ (score of 2), i.e. minimal joint displacements that operators would typically not report.
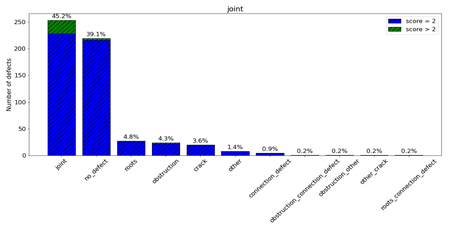 Figure 7: Repartition of the defects identified by VAPAR as ‘joint defects’.45.2% of these defects were indeed joint defects; 39.1% were not defects, etc. The colour represents the fraction of micro defects (blue; score of 2) and bigger defects (green, score higher than 2).
VAPAR performance — cracks
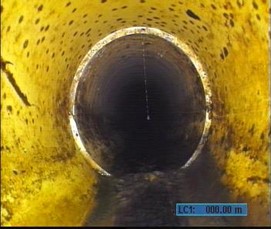 Figure 8: Example of a minor joint displacement identified by VAPAR algorithm (score = 2) but typically not reported by operators.
The VAPAR algorithm only missed 7.8% of the cracks (recall of 92.2%) and had a relatively high precision (71.3%). This high performance originates from the fact that cracks are one of the most common defects in sewer and stormwater pipes; large datasets were therefore available to calibrate the VAPAR algorithm for this type of defect.
Since the performance of deep-learning algorithms increase with the size of the datasets used for calibration, this could explain the relatively high scores.
VAPAR performance — other
All defects that did not enter one of the six categories listed above were ranked in the ‘other’ category. Both the recall (72.9%) and precision (50.5%) were below average. This is because the ‘other’ category includes a large range of uncommon defects for which the VAPAR algorithm could not be fully trained given the limited datasets.
Figure 9 shows that the VAPAR algorithm generated ‘false alarms’ in less than 11% of cases as only 10.9% of the defects identified by VAPAR in this category were not actual defects.
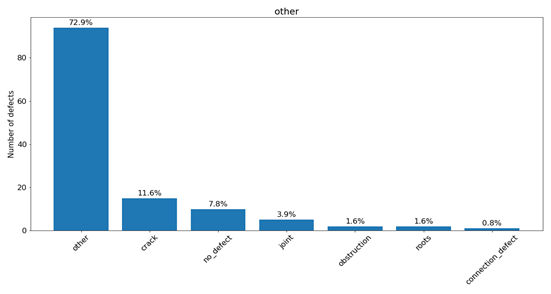 Figure 9: Repartition of the actual category of defects for the 1m-long pipe sections identified by VAPAR algorithm as having a defect in the ‘other’ category.
Impact of the pipe category
The dataset used for this analysis was composed of 1913 m of stormwater drains and 681 m of sewer pipes.
Figure 10 shows that the VAPAR algorithm overall performed better in stormwater drains than in sewer pipes. This is because visibility is in general better in stormwater, which makes the identification of defects easier.
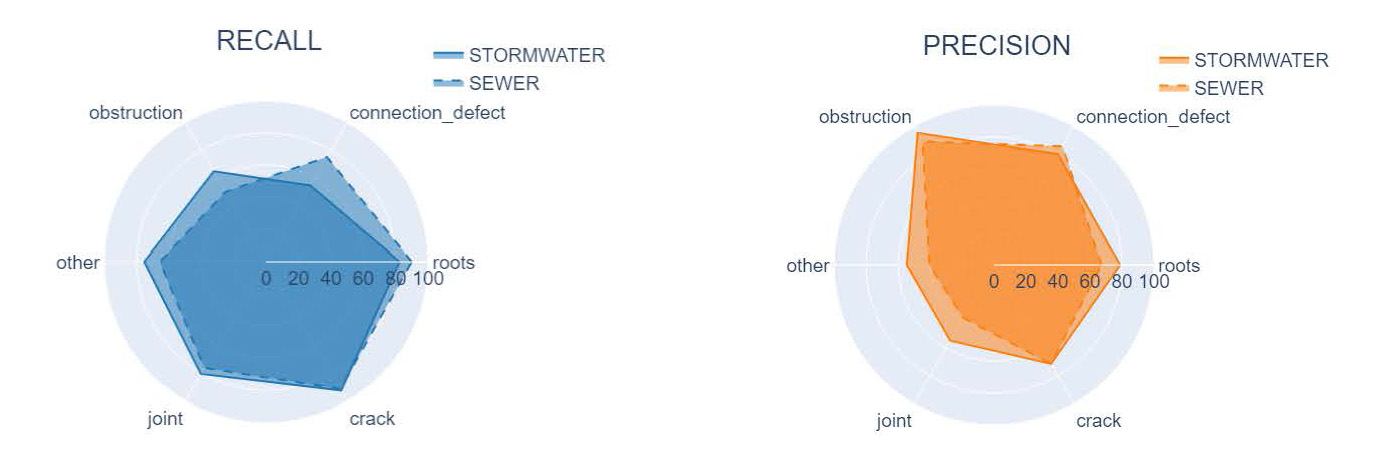 Figure 10: Recall and Precision for each category for different type of pipes
Impact of the pipe diameter
Figure 11 shows that the VAPAR algorithm performance slightly increases with the pipe diameter, which is explained by better visibility in bigger pipes.
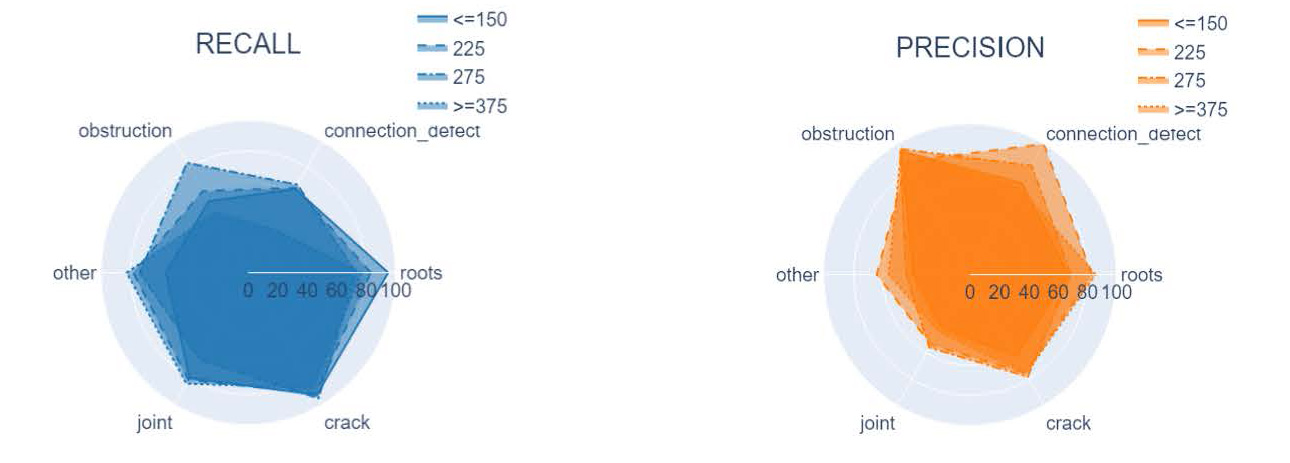 Figure 11: Recall and Precision for each category for different pipes diameters
Impact of the pipe material
Figure 12 shows that the VAPAR algorithm performed better on concrete pipes (CP) and reinforced concrete pipes (RC) than on vitrified clay pipes (VC). This is most likely related to the fact that stormwater pipes are usually made of concrete or reinforced concrete, so the visibility in these pipes is slightly better.
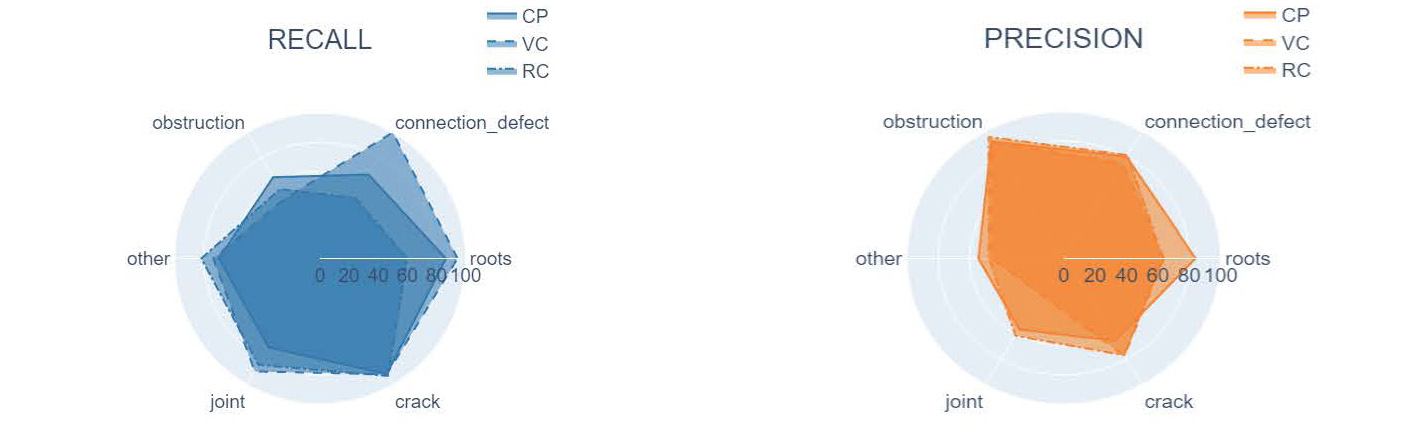 Figure 12: Recall and Precision for each category for different pipes materials
Operator performance
Figure 13 shows that the recall of the VAPAR algorithm is higher than the recall of the operator for all categories of defects apart from connection defects and obstructions. When considering all the defects identified in the ‘reference’, the overall recall of the VAPAR algorithm was higher than the operator recall: while the VAPAR algorithm missed 13.2% of defective 1 m-long sections (recall of 86.8% for the ‘all’ category), the operator missed 36.6% of these sections.
The relatively low recall of operators is in the same order of magnitude as the recall of approximately 75% reported by Dirksen et al. (2013). The precisions for obstructions and connection defects were similar for the operator and VAPAR algorithm, but the operator had a higher precision for all other categories of defects. The overall precision of the operator was 92.2%, which is also in line with the observations of Dirksen et al. (2013).
VAPAR precision was overall estimated at 71.9%, which means that 28.1% of the 1 m sections identified as defective by VAPAR had no defects. This is because the VAPAR analysis identified micro-defects that would typically be not reported by operators. This is particularly true for the minor joint displacements as shown in Figure 13.
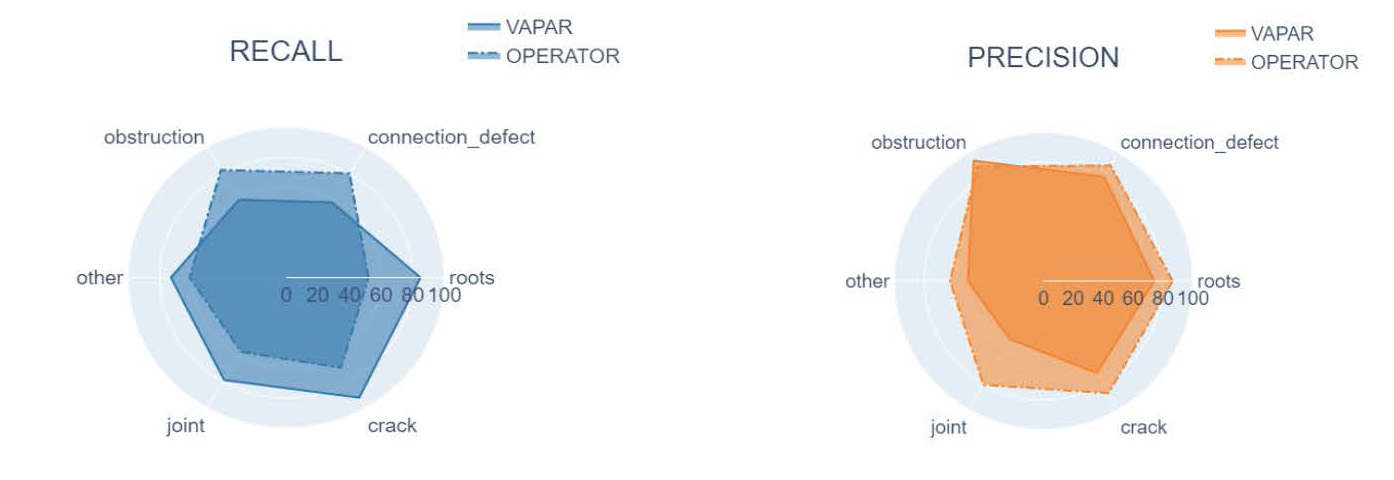 Figure 13: Recall and Precision for each category for VAPAR and the operator
Structural grades
Figure 14 shows that the VAPAR analysis is significantly more accurate than the operator when assessing the structural grades of pipes. VAPAR correctly estimated the structural grade of pipes for 79.8% of inspected pipes and was within a grade of +/-1 around the actual grade for 93.4% of the pipes.
In comparison, the operator properly assessed the structural grade in 48.5% of pipes and was within a grade of +/-1 around the actual grade for 76.3% of pipes. In particular, the operators tend to overestimate an important percentage of the structural grades, which may lead to non-necessary pipe rehabilitation if this assessment is used to direct the pipe rehabilitation program.
On the contrary, Figure 14 shows that operators gave 13 pipes a structural grade of 1 while their actual grades were 3 or 4. This underestimation of the structural grades could lead to ignoring pipes that might be in critical condition, leading to operational issues in the near future.
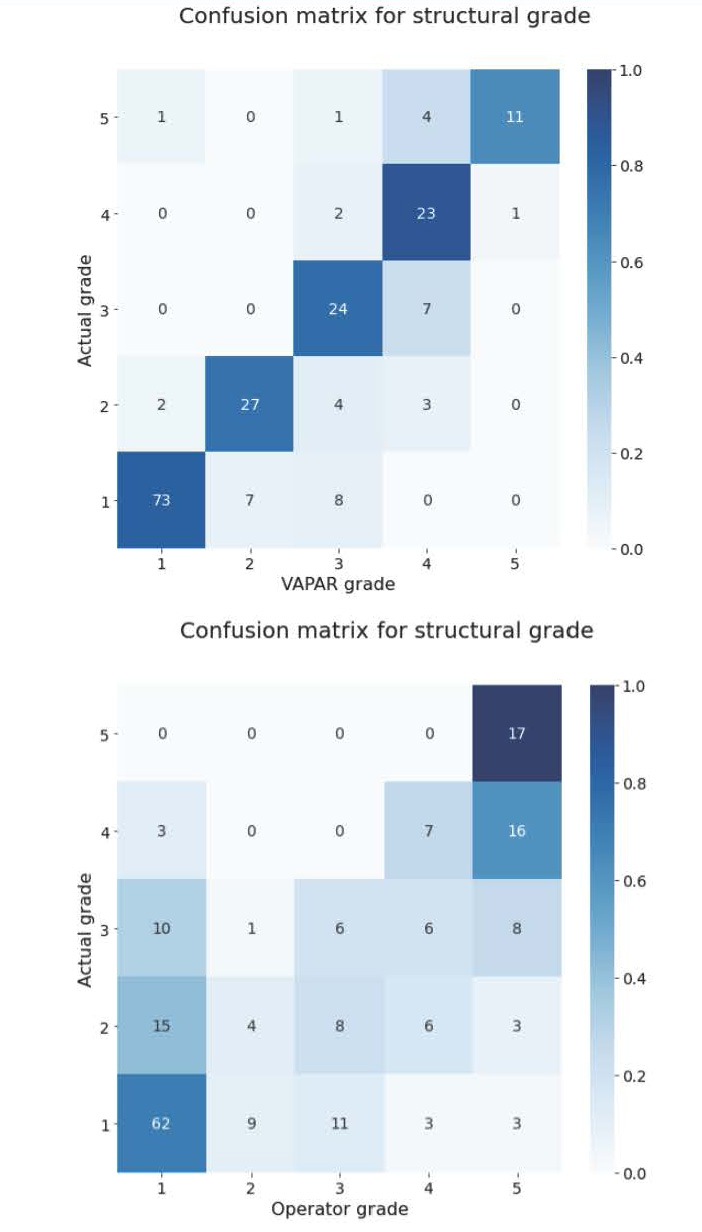 Figure 14: Confusion matrices for structural grades of 198 pipes (Left: VAPAR; Right: operator). Numbers in each square represent the number of pipes that fall into the category represented by axes. The colour represents the proportion of correctly classified pipes for an actual grade.
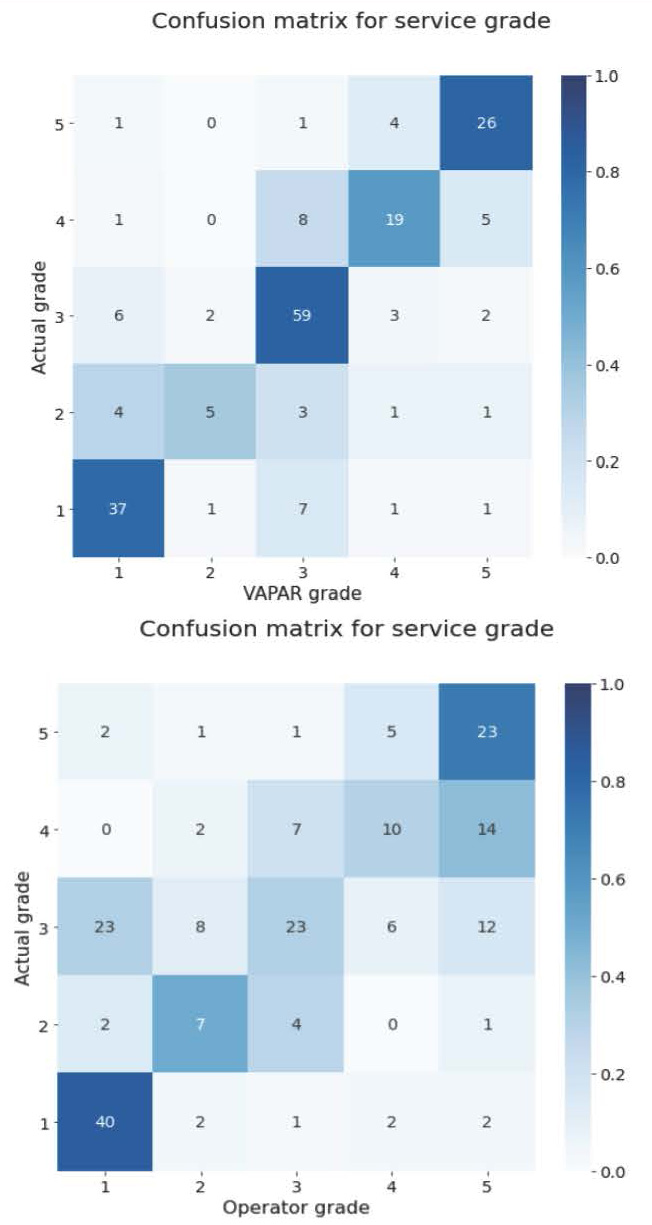 Figure 15: Confusion matrices for service grades of 198 pipes (Left: VAPAR; Right: operator). Numbers in each square represent the number of pipes that fall into the category represented by axes. The colour represents the proportion of correctly classified pipes for an actual grade.
Service grades
Figure 15 shows that the VAPAR algorithm was also relatively more accurate than operators to estimate the service grade, with a total of 151 videos with a correct service grade of 76.3%, and 88.9% of grades within +/-1 around the actual service grade (against 52.2% and 76.3% for the operator, respectively).
Overall, the higher performance of the VAPAR algorithm to evaluate the structural and service grades of pipes is explained by the fact that the VAPAR algorithm misses a minimal number of defects (recall of 86.8%) compared to operators (recall of 63.4%).
The relatively lower precision of VAPAR compared to operator precision is mostly related to micro-defects (low scores), which also do not significantly impact the grades from VAPAR. This explains the relatively good performance of VAPAR compared to operators when evaluating the structural and service grades of pipes.
Conclusion
From this study, the operator had higher recall for connection and obstruction defects, with similar precision. However, for roots, cracks and joint displacement, VAPAR had greater recall but lower precision.
Overall, the VAPAR algorithm missed less defects in sewer and stormwater pipes (13.2%) than operators during visual inspection (36.6%). However, the VAPAR algorithm was overall found to be slightly oversensitive and generated false alarms 28.1% of the time, as opposed to just 7.8% for the operator.
This study also revealed that the VAPAR algorithm was significantly more accurate than the operator at condition grading the pipes, with an accuracy within 76.3%-79.8% against 48.5%-52.2% for the operator.
Because maintenance and rehabilitation programs are typically based on these service and structural grades, the use of the VAPAR algorithm could help to better identify assets that require cleaning or rehabilitation.
About the author
Dr Quentin Bechet | PhD, Project Manager at Veolia
Dr. Quentin Bechet started his career in academics. He obtained his PhD in mathematical modelling in New Zealand (completed in 2014) and went on to undertake a postdoctoral position in France (finished in 2016). He then moved to Australia and joined Veolia to help the development of digital services to Victorian Water utilities. In particular, he develops solutions to help water utilities to better use their data to optimise operations, using mathematical modelling and artificial intelligence.
Xavier Philoleau | Data Scientist at Veolia
Xavier Philloleau is a data scientist specialised in machine-learning and deep-learning who graduated from CentraleSupelec (Paris, France). He has been working for Veolia Water since February 2020.
Melissa Mellado-Ruiz | Business Development Manager at Veolia
Melissa Mellado-Ruiz has completed two Master of Science degrees in environmental services engineering and international management in France before joining Dalkia industrial energy division in 2013 as international key account manager. She then joined Veolia to support the development of digital and resilience offers, developing synergies between water, waste and energy activities worldwide. She moved to Australia in October 2019 to support Veolia’s municipal water business development and the deployment of digital solutions in partnership with water utilities and councils.
Amanda Siqueira | Civil/Environmental Engineer, CEO and Cofounder at VAPAR
Amanda Siqueira is a civil and environmental engineer who has worked in design, construction and remediation of drainage and sewer pipes in Australia, New Zealand and the UK. During her time in the engineering industry, Amanda has both managed and completed several large-scale civil engineering projects from inception at both Arup and WSP Opus. She has a passion for all things pipes and is also one of the co-founders of VAPAR, a start-up company that was created after experiencing first-hand the manual and expensive ways that infrastructure data is assessed and stored.
Michelle Aguilar | Mechatronics Engineer, CTO and Cofounder at VAPAR
Michelle Aguilar has a degree from UTS in Mechatronics Engineering with a sub-major in intelligent systems. She completed a 12-month project which was based on real time manipulation of robots by imitating human movements. This project was selected to be presented in China at the International Joint Conference of Artificial Intelligence (IJCAI) robotics competition where it was awarded 3rd place from over 10 entrants around the world. Her in-depth experience in software programming, web development, along with industrial and business automation gave her the foundation to lead the technical strategy and implementation at VAPAR.
References
J. Dirksen, F. H.L.R. Clemens, H. Korving, F. Cherqui, P. Le Gauffre, T. Ertl, H. Plihal, K. Müller & C. T.M. Snaterse (2013) The consistency of visual sewer inspection data, Structure and Infrastructure Engineering, 9:3, 214-228, DOI: 10.1080/15732479.2010.541265
Water Services Association of Australia, 2013, WSA 05-2013 Conduit Inspection Reporting Code of Australia, Third Edition, Version 3.1.
Share