B Dalrymple, M Wicks, W Jones, B Allingham.
First published in Water e-Journal Vol 6 No 1 2021.
Abstract
‘Gully pit inserts’ (or ‘gully baskets’) are a commonly applied stormwater control measure given they can often be easily integrated into gully pits with no impact to the usability of the area. Stormwater treatment performance monitoring has been undertaken for a gully pit with a fine grade (200-micron) bag of 300mm depth in a car-park in Western Sydney, NSW, Australia. The gully pit insert receives runoff from a 100% impervious car-park area of 400m2. Influent and effluent water quality samples were collected using automated samplers, which were connected to pre-configured and calibrated flow analysis of treated effluent and sample pacing with remote communication and data access. Collected samples were delivered to and analysed in a NATA-accredited laboratory for pH and concentrations of suspended solids and nutrient species. Monitoring was undertaken between December 2019 and March 2021, with a total of fifteen (15) runoff events recorded during this period. The performance testing demonstrated that the gully pit insert was able to achieve significant reductions in stormwater pollutant concentrations, with a concentration reduction efficiency ratio for total suspended solids, total phosphorus and total nitrogen of 52, 67 and 41% respectively.
Introduction
Over recent decades, the implementation of stormwater control measures (SCMs) to achieve a more water-sensitive urban environment and reduce the hydrologic and water quality impacts of urban development has increased across Australia and overseas. ‘Gully pit inserts’ (or ‘gully baskets’) are a commonly applied SCM given they are often easily integrated into gully pits with no impact to the usability of the area and demonstrated ability to retain pollutants otherwise conveyed downstream into stormwater infrastructure and waterways.
The OceanGuard® technology is a gully pit insert designed to fit within new and existing gully pits to remove pollution from stormwater runoff. The system has a choice of filtration liners, designed to remove gross pollutants, total suspended solids and attached pollutants as either a stand-alone technology or as part of a ‘treatment train’ with other stormwater treatment assets that provide additional treatment.
Study authors and the Engineering Department of the Western Sydney University subsequently developed and implemented a gully pit insert testing regime to obtain further field-based evidence of its performance within Australia.
Methodology
Site details
The site is located at a carpark in Western Sydney, Kingswood, NSW, Australia (hereafter referred to as ‘the site’). The carpark is swept periodically, but minor amounts of sediment and organic debris are typically present at the site. The carpark consists entirely of an impervious asphalt surface and has a high usage rate.
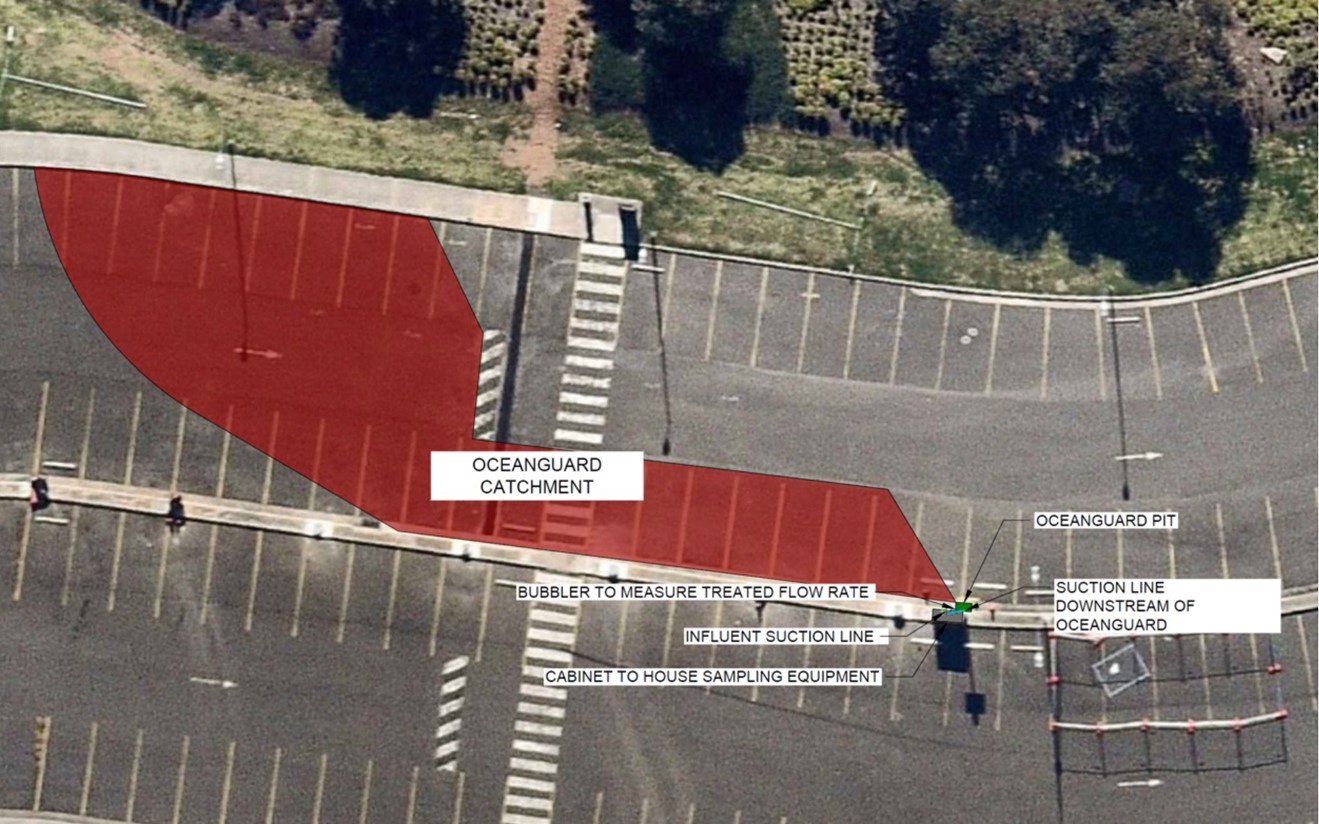
An aerial photo of the site from February 2020 is shown in Figure 1.
Figure 1: Aerial photo of the site, catchment & equipment
An OceanGuard® gully pit insert was installed within an existing gully pit within the car park. The system receives runoff from a 100% impervious area of 400m2, determined by land survey and site inspections. The catchment is illustrated in Figure 1.
The gully pit insert was installed at the site in August 2019. The gully pit is a 900mm x 600mm square pit, and the gully pit insert has a fine grade (200 micron) bag of 300mm depth, with a design treatable flow rate of 20 L/s (Ocean Protect, 2020).
Example photos of the gully pit insert, sampling facilities and catchment at the site are provided in Figure 2. A conceptual diagram of the gully pit insert installed at the site is provided in Figure 3. A schematic of the system is provided in Figure 4.
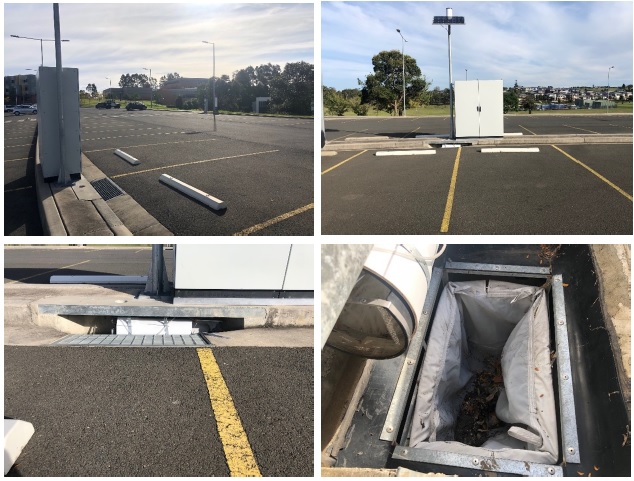 Figure 2: Example photos of the gully pit insert, sampling facilities and catchment at the site
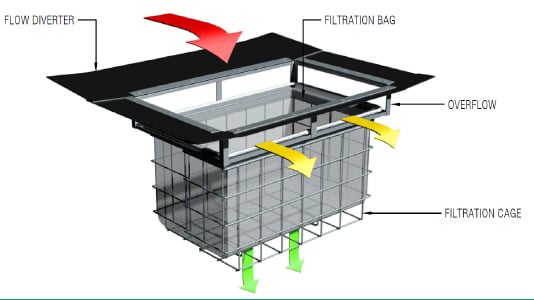 Figure 3: Conceptual diagram of gully pit insert at site
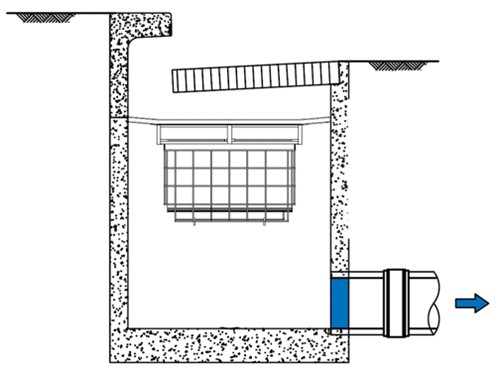 Figure 4: Schematic section drawing of gully pit insert at the site
The gully pit insert at the site has been maintained in accordance with typical/ standard maintenance procedures for these assets. In summary, the system is maintained approximately every four (4) months, with maintenance undertaken on 14 February 2020,4 June 2020, 27 November 2020 and 25 March 2021.
Any material on the outer flaps is brushed into the 200-micron bag and is removed from the gully pit insert. The contents are emptied, removing any debris and litter, and the bag is inspected. and placed back into the gully pit insert.
It should be noted that when cleaning the pit of debris during maintenance on 14 February 2020, it was noticed that ‘flakes’ (small particles) of concrete from the pit chamber walls and floor were observed within the chamber, which would be anticipated to flow downstream and contribute to contributing to elevated solids levels in effluent samples at the site. It is likely that this flaking of concrete from the pit chamber walls and floor was occurring throughout the duration of the monitoring period until 12 June 2020. On 12 June 2020, works were undertaken to seal the pit chamber with waterproofing to prevent small particles from the pit chamber walls and floor entering the effluent sampler.
Sampling design
The equipment and sampling techniques used for this study were in accordance with the Project Plan developed by Ocean Protect in consultation with both City of Gold Coast’s (2016) Development Application Requirements and Performance Protocol for Proprietary Devices and Stormwater Australia’s (2018) Stormwater Quality Improvement Device Evaluation Protocol Field Monitoring. The Project Plan incorporated criteria from each protocol and a summary of conditions for the field-testing protocol are summarised below in Table 1.
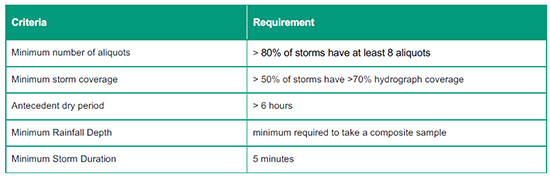 Table 1: Summary of required field testing protocol at site
Ocean Protect personnel were responsible for the installation, operation, and maintenance of the sampling equipment. Ocean Protect personnel provided sample retrieval, system reset, and sample submittal activities for all events up to and including 4 September 2020, whilst ALS were responsible for these tasks for subsequent events. Water sample processing and analysis was performed by ALS.
A small double-door cabinet was provided, installed, maintained, and operated by Ocean Protect personnel for sampling purposes. The cabinet is a fully enclosed, self-contained stormwater monitoring system, specially designed and built by Ocean Protect for remote, extended-deployment stormwater monitoring. The design allows for remote control of sampling equipment, eliminates confined space entry requirements, and streamlines the sample and data collection process and operation of the equipment.
Influent and effluent water quality samples were collected using individual ISCO 6712 Portable Automated Samplers configured for 9.5 litre wide-mouth carboy bottles with disposable sample liners for sample collection. The samplers were connected to one 12V DC battery recharged with a solar panel mounted to the roof of the shipping container. The influent sampler was equipped with an ISCO 730 Bubbler Weir module, connected directly to the ISCO 6712 sampler, and installed within a pre-configured and calibrated 152 mm diameter Thel-mar Weir for influent flow measurement and sample pacing. The ISCO 6712 effluent sampler was setup as a ‘slave’ and triggered from pulses received from the influent sampler at specific flow volumes pre-determined for every storm event. Flow rates were recorded every minute.
The bubblers were regularly checked for calibration by submersing the weir in water and confirming/setting the depth of water on the sampler with the bubbler module to the depth measured. The tables for the flow against height are provided by Thel-mar LLC and input into the samplers.
Rainfall was measured at 1-minute intervals using two 0.25mm resolution ISCO 674 tipping bucket-type rain gauge, factory-calibrated, securely installed on a post and regularly inspected. The ISCO 674 rain gauge was connected directly to the ISCO 6712 Influent sampler. The sample intake for each automated sampler was connected to an ISCO low-profile stainless-steel sample strainer (9/16″ diameter, 6″ length, with multiple ¼″ openings) via a length of 3/8″ ID Acutech Duality PTFE tubing. The rain-gauge is factory calibrated and does not require further calibration except to ensure there is nothing obstructing or interfering with the tip bucket. The rain gauge was installed and maintained according to manufacturer’s instructions and checked and cleared of debris regularly. The rain gauge was located on a post and protected from excessive wind velocities that could skew accuracy of measurement. An additional ISCO 674 rain gauge was located 100 m away for reference and redundancy.
Sample strainers and flow measurement equipment were secured to the invert of the influent and effluent pipes using stainless steel spring rings with all components supplied and setup in general accordance with ISCO’s guidelines. Each sampler was also connected to a computer to allow for complete data access. Cameras were installed in the pit to additionally confirm the presence of bypass flows for all storm events.
Samplers were programmed to enable the sampling program to trigger on flow. Once enabled, the samplers collected flow-proportional samples allowing the specified pacing volume to pass before taking a sample. The sample collection program was a one-part program developed to maximise the number of water quality aliquots/samples collected as well as the coverage of the storm event for an anticipated rainfall depth. Influent and effluent sample collection programs were configured to collect a minimum of eight aliquots per bottle. Due to the variability among predicted precipitation events, the sample pacing specifications were varied (flow pacing and aliquot volume) in consultation with the most up-to-date precipitation forecasts and programmed by Ocean Protect personnel prior to every storm event.
Following a precipitation event, Ocean Protect personnel communicated with the automated sampling equipment to confirm sample collection and then dispatch personnel to retrieve the samples and reset the automated sampling equipment. Samples where then split using the appropriate Bel-Art’s Churn Splitter – one for the influent and one for the effluent to reduce the likelihood of contamination and to provide subsamples in accordance with the manufacturer’s guidelines. Sub-samples were delivered to ALS (a NATA-accredited laboratory) on ice (<4o C) and accompanied by chain-of-custody documentation and analysis was carried out in accordance with Table 2.
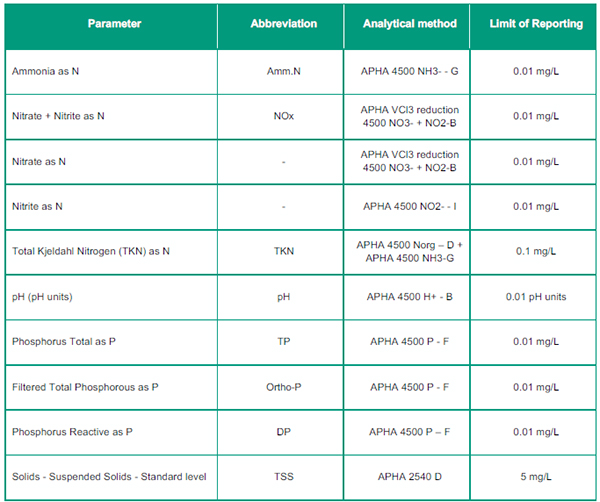 Table 2: Water quality analytical parameters and methods for the site
Sampling events
The gully pit insert was monitored between December 2019 and March 2021, with a total of fifteen (15) runoff events recorded during this period. Figure 5 illustrates the timing of the sampling events compared to a time series of rainfall data recorded at the site. Table 3 also provides a summary of recorded rainfall at the site and flow discharged from the system.
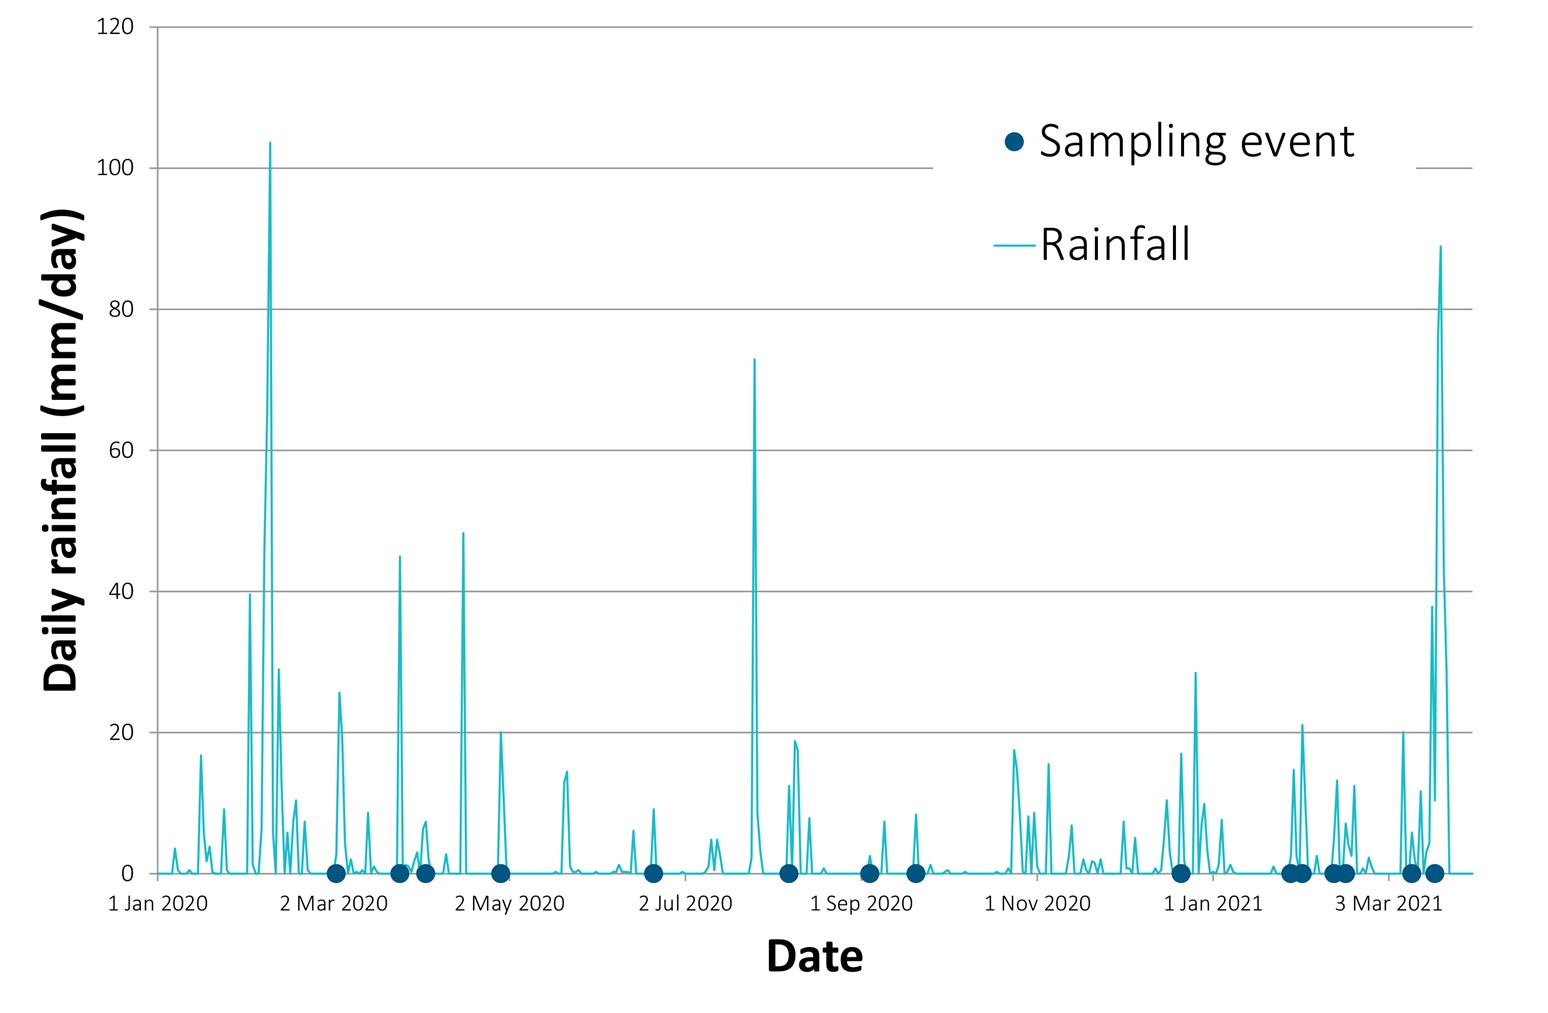 Figure 5: Time series of site rainfall and timing of sampling events
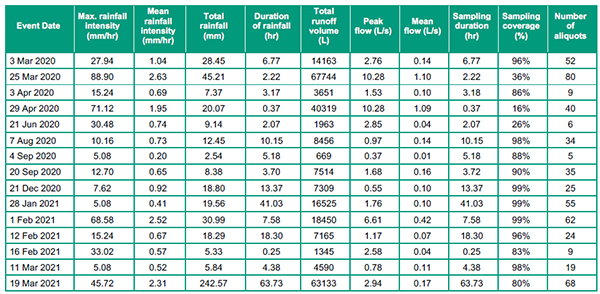 Table 3: Summary of recorded rainfall and flow data for site
A total of three (3) runoff events were excluded from the analyses. One event (on 31 March 2020) was excluded due to recording elevated influent total nitrogen concentrations above the allowable limit within the Project Plan. One event (on 30 April 2020) was excluded due to the recording elevated influent total phosphorus concentrations being above the allowable limit within the Project Plan. The other excluded event (21 May 2020) was due to the sampling system being off-line for the installation of a solar panel by Western Sydney University personnel.
Results and discussion
Table 4 provides the results of the monitoring. Table 5 provides the calculated concentration reduction efficiencies (CREs). Table 6 provides a statistical summary of the monitoring results. Table 7 provides the influent nitrogen speciation percentages recorded at the site. Table 8 provides a comparison of influent event mean concentration (EMC) values recorded at the site and those given in MUSIC modelling guidelines within Australia by Water By Design (2010), BMT WBM (2015) and Melbourne Water (2018). Table 9 provides a comparison of the percentage fraction of total nitrogen as dissolved nitrogen against that recommended in the E2DesignLab (2015) report Development Application Requirements and Performance Protocol for Proprietary Devices on the Gold Coast. Table 10 also provides a comparison of influent nitrogen speciation data for the site with runoff data for other sites within Australia and E2DesignLab (2015) recommended values.
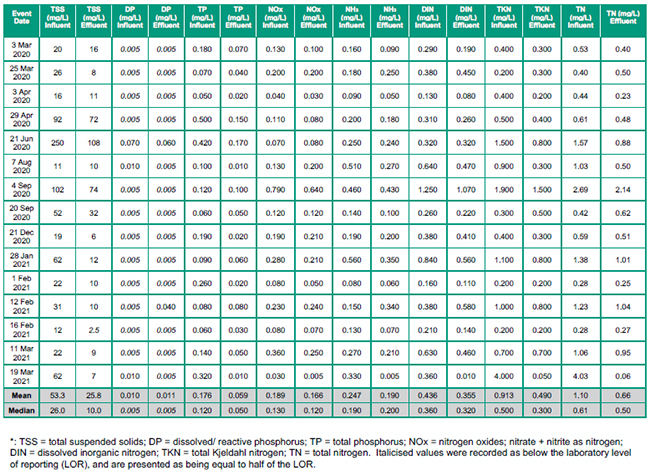 Table 4: Results of treatment performance monitoring
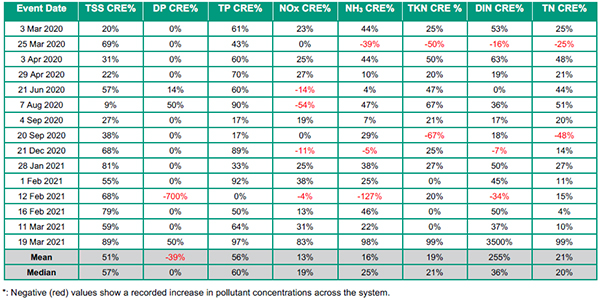 Table 5: Concentration reduction efficiencies
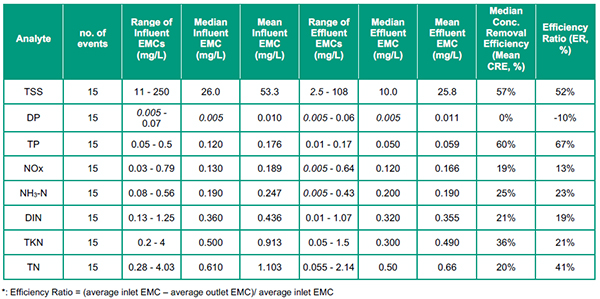 Table 6: Statistical summary of monitoring results
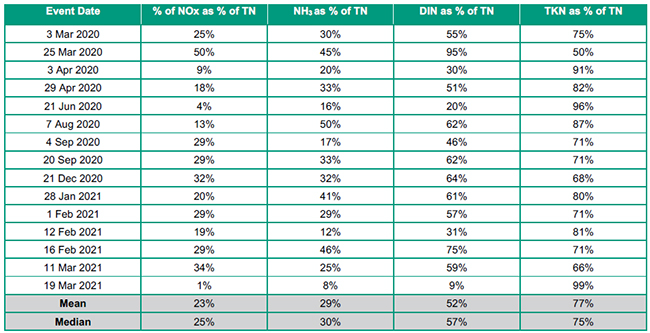 Table 7: Influent nitrogen speciation percentages recorded at site
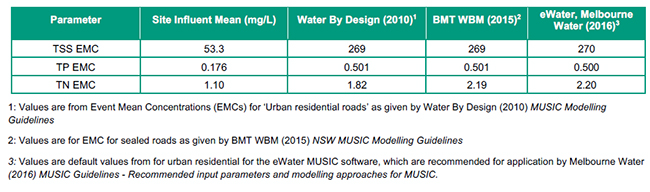 Table 8: Comparison of site influent EMC with MUSIC guideline EMC values
 Table 9: Comparison of site influent % dissolved nitrogen with E2DesignLab (2015) recommended values
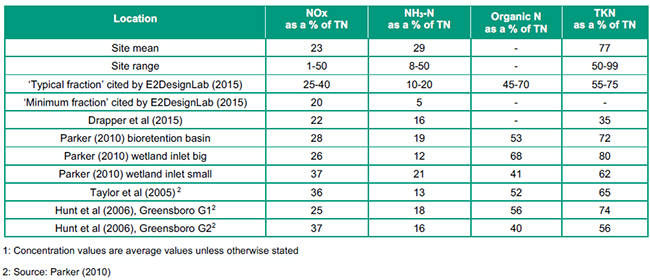 Table 10: Comparison of site influent nitrogen speciation with runoff data for other sites within Australia and E2DesignLab (2015) recommended values
Suspended solids
Reductions in TSS concentrations were recorded for all events, with a concentration reduction efficiency ratio of 52% (with concentration reductions ranging from 9 to 89%).
TSS concentrations in stormwater flowing from the car park catchment (and entering the gully pit insert) were significantly lower than that recommended in given MUSIC guidelines for comparable land usages. For example, the mean TSS concentration recorded in inflows to the gully pit insert was 53.3 mg/L, significantly lower than the Water by Design (2010), BMT WBM (2015) and Melbourne Water (2016) guideline recommended EMC values of 269 and 270mg/L.
As described by Neumann et al (2010), for example, it is easier for SCMs to achieve higher pollutant concentration reduction rates when runoff has higher pollutant concentrations. Higher TSS concentration reductions would subsequently be anticipated for gully pit inserts receiving flows with TSS concentrations similar to values recommended in the aforementioned guidelines.
It is clear that the observed ‘flaking’ of concrete from the pit chamber walls and floor into the pit chamber (described in Section 2.1) would have contributed to elevated TSS concentrations in the effluent samples (and subsequently contributed to observed lower TSS concentration reductions) until the sealing of the pit chamber on 12 June 2020. This anomaly negatively biased the results for TSS as some of the particles measured within the TSS effluent for each storm were derived from the pit and not sampled as stormwater from the influent sample. Prior to the rectification works and given no bypassing of storm flows were evident, analysis of the effluent particle size distribution showed particles greater than the pore aperture of the filter liner in outlet flows, i.e. 200micron. Subsequent particle size distribution analysis after the sealing of the pit chamber indicated no particles in the effluent greater than 200micron. Therefore, the gully pit insert would have achieved higher TSS removal efficiencies than recorded in the monitoring results until 12 June 2020.
Nutrients
TP and TN concentration reduction efficiency ratios observed across the system were 67% and 41% respectively. Total phosphorus and nitrogen EMCs observed in flows to the gully pit insert at the site were significantly lower than that recommended by aforementioned MUSIC guidelines. As for TSS, the ability of any SCM to reduce nutrient concentrations would be decreased at lower inflow concentrations.
The majority of the recorded phosphorus concentrations observed in flows to and from the gully pit insert consisted of particulate phosphorus, with relatively low concentrations of dissolved phosphorus. For nitrogen, a mean of 52% of recorded inflow concentrations were dissolved (ranging from 9 to 95%), which complies with the recommended minimum mean of 40% given by E2DesignLab (2015). The percentage of nitrogen speciation for NOx and NH3 comply with the recommended minimum fractions given by E2DesignLab (2015), and proportions of nitrogen species are similar to values observed at other sites (presented in Table 10).
Further investigations
The aforementioned stormwater treatment performance monitoring is anticipated to continue until approximately the end of 2021 to obtain further confidence in relation to the performance of the gully pit insert. Samples are also likely to be collected for the subsequent analysis of additional water quality indicators (e.g. hydrocarbons, heavy metals, bacteria) to assess the influent concentrations of these water quality indicators (if detectable) and the associated performance of the gully pit insert to reduce these concentrations.
Conclusion
Stormwater treatment performance testing was undertaken for a gully pit insert located in a car park at Western Sydney, NSW, Australia. The sampling and monitoring protocol was designed and implemented in consultation with both City of Gold Coast’s (2016) Development Application Requirements and Performance Protocol for Proprietary Devices and Stormwater Australia’s (2018) Stormwater Quality Improvement Device Evaluation Protocol Field Monitoring.
The performance testing at the site demonstrated that the gully pit insert was able to achieve significant reductions in stormwater pollutant concentrations, with a concentration reduction efficiency ratio for TSS, TP and TN of 52, 67 and 41% respectively. These concentration reductions were achieved despite relatively low concentrations for TSS, TP and TN in incoming stormwater flows (which would be expected to decrease potential concentration reductions), and ‘flaking’ of concrete from the pit chamber walls and floor.
Stormwater treatment performance monitoring at the site will continue until approximately the end of 2021 to obtain further confidence in relation to the performance of the gully pit insert.
Acknowledgements
The following reviewers are gratefully acknowledged for their critique of this paper:
- Associate Professor N (Nina) Evans PhD, professorial lead in Science, Technology, Engineering and Mathematics (STEM), University of South Australia
- Professor JE (Kobus) van Zyl Ph.D., Watercare Chair in Infrastructure, Department of Civil and Environmental Engineering, University of Auckland
About the authors
Brad Dalrymple | Brad is a Principal Environmental Engineer at Ocean Protect. Brad has over twenty years’ experience in various projects associated with environmental engineering, and has CPEng and RPEQ accreditation. Brad has been responsible for the planning, design and implementation of integrated water management and water sensitive urban design strategies for a range of applications – from many small-scale ‘retrofit’ projects, several high-profile and award winning master-planned communities, and catchments and regions.
Michael Wicks | Michael has owned the company for almost a decade and leads the business’ technical direction and oversees research and development. He is responsible for new product development and managing the engineering design team at Ocean Protect ensuring cost-effective environmental outcomes for developments. He has a Bachelor of Engineering (Civil) from the University of Western Sydney and has 20+ years’ experience in the sector. He has sat on the committees of the NSW, Victoria and Queensland Storm Water Associations.
Warren Jones | Warren Jones is the Lead Engineer and Engineering Manager at Ocean Protect. Warren plays a key role in shaping Ocean Protect’s stormwater field testing capabilities, providing expertise from design and implementation through to collection and analysis. He has also designed, developed and deployed multiple software programs focused on automation of tasks and retrieval of information.
Blake Allingham | Since January 2019, Blake has been heavily involved in the design, implementation, operation and management of a range of stormwater treatment performance monitoring programs for Ocean Protect. This has included monitoring at a total of three sites, with a fourth recently approved – all in Western Sydney, NSW.
References
BMT WBM, 2015. NSW MUSIC Modelling Guidelines. Prepared for Greater Sydney Local Land Services.
Ocean Protect, 2020. OceanGuard Technical Design Guide.
Drapper D, Lucke T. 2015. Characterisation of Stormwater Pollutants from Various Catchment types in South-east Queensland. Presented at the 2015 WSUD & IECA Conference.
E2DesignLab, 2015. Development Application Requirements and Performance Protocol for Proprietary Devices on the Gold Coast. Prepared for the City of Gold Coast, 2015, Originally Prepared by DesignFlow. Peer Reviewed and Amended by E2DesignLab.
eWater, 2014. MUSIC by eWater User Manual.
Hunt, W., Jarrett, A. R., Smith, J. T., & Sharkey, L. J., 2006. Evaluating Bioretention Hydrology and Nutrient Removal at Three Field Sites in North Carolina. Journal of Irrigation and Drainage Engineering, 2006, 132(6), 600-608.
Melbourne Water. 2016. MUSIC Guideline – Recommended input parameters and modelling approaches for MUSIC users.
Neumann, L N, Sharma A. 2010. Literature Review on Performance Testing Approaches for Gross Pollutant Traps. CSIRO: Water for a Healthy Country National Research Flagship.
Parker, N. 2010. Assessing the Effectiveness of Water Sensitive Urban Design in Southeast Queensland. Thesis submitted towards Masters of Engineering. Queensland University of Technology.
Stormwater Australia, 2018. Stormwater Quality Improvement Device Evaluation Protocol Field Monitoring V1.3.
Taylor G D, Fletcher T D, Wong T H F, Breen P F, Duncan H P, 2005. Nitrogen Composition in Urban Runoff – Implications for Stormwater Management. Water Research, 2005, Vol 39, pp 1982-1989.
Water By Design, 2010. MUSIC Modelling Guidelines. Brisbane: South East Queensland Healthy Waterways Partnership.
Share