


E Johnson.
First published in Water e-Journal Vol 6 No 1 2021.
Abstract
Implementing smart water metering systems has numerous potential benefits for both a utility and its customers. Despite the benefits, implementing smart metering systems also introduces asset anomalies and data errors associated with unusual and abstruse technological aspects of these systems. The various technologies required for each component of the data chain, as well as the multiple interfaces through which the data are filtered, condensed, or altered, impose limitations on the amount and quality of the data that are ultimately made available to the utility. A selected sample of technological aspects of smart metering systems was examined within a holistic framework of risk assessment and components of a generic data chain/pathway. Anomalies were identified that have seldom been addressed in literature before. The perception that implementing smart metering will automatically result in rich data and optimal information, is therefore not necessarily correct. A particular smart metering solution is generally a compromise, because of current technology developments, regulations and the relevance of applicable standards. This ‘bottom-up’ approach used, is technologically agnostic and can also assess future technological developments. Highlighting these technological aspects in this paper facilitates the identification of risk mitigation strategies to reduce or eliminate the impact of the asset anomalies.
Introduction
Implementing smart water metering systems, also known as intelligent or digital water metering systems, has multiple benefits when compared to traditional manually-read mechanical meter fleets. These systems can be categorised within the Internet of Things (IoT). Researchers have previously identified 75 potential benefits of digital meters for both the water utility and its customers (Monks, et al, 2019). The adoption of smart water metering is generally driven by corporate objectives defined by the water utility. The objectives could initially be motivated by a strategy to modernise the meter fleet, to solve a particular operational problem or to introduce universal metering for those cities that previously did not apply volumetric based charges. These and other business objectives linked to many of the benefits of smart water metering systems have a degree of uncertainty or risk. Risk is usually expressed in terms of its source, potential events, consequences and likelihood (AS/ISO 31000, 2018). Asset and data risks associated with smart water metering systems have to be assessed through their identification, analysis and evaluation in order to guide the decision-making process. This decision-making relates to the selection of those technologies most suitable for meeting the originally defined objectives and for attaining the envisaged benefits. Uncovering potential asset anomalies and sources of data errors associated with various smart water metering technologies facilitate the commencement of the risk assessment process, which ultimately guides the decision-making process. This is a preferred strategy to the alternative of being unaware, ignoring or under-estimating the risks. Identifying and assessing risks associated with the various metering, communication and software technologies emphasises their functionalities and capabilities, which ultimately informs the choice of the solution that best meets the objectives of the utility.
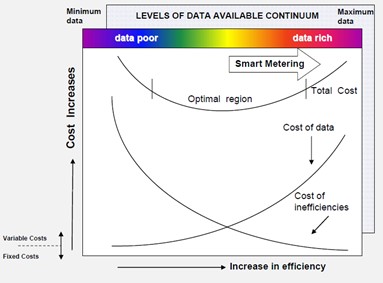
Information itself is derived from the collection, processing, and interpretation of data. The provision of any information should be carefully assessed to determine its purpose, need, provision and cost. This assessment should be undertaken prior to devising the system or systems for capturing data and deriving information. Too little data can inhibit decision-making and incur additional costs due to unidentified risks. Too much data can incur the additional costs of obtaining, processing, and managing data as well as overwhelming the assimilation process required to facilitate decision-making. The ideal level of data lies somewhere between these two extremes and is different for different organisations. The provision of information for a water utility should be organised rather than just allowed to happen. Only if the right data is captured can the information be useful. Its monitoring, capture, validation, processing, and reporting requires careful and considered planning if the information derived is to be useful and reliable. The type and amount of data captured, as well as the degree with which it is filtered, condensed, or altered as it travels along the data pathway through the various interfaces, ultimately dictates its suitability for various applications. The level of data available to a water utility is directly related to the amount invested in the capture, collection, transmittal, processing, manipulation, representation, and application of the data. The ongoing operating costs such as those related to a telecommunications provider of this data comprises both fixed (capital costs such as initial purchase of smart metering assets) and variable costs (ongoing operating costs such as those related to a telecommunications provider).
The concept of the optimal level of data is illustrated in Figure 1. In data-poor situations where there is minimum data available due to lack of investment in infrastructure (e.g. such as metering systems) the cost of data will be low, but this will most likely result in greater inefficiencies (e.g. such as metering error related losses). If the alternative is considered where there is too much investment in data, the cost of this data will be higher. However, the cost of inefficiencies will theoretically be lower. The combination of cost of inefficiencies and the cost of data reaches a minimum between these two extremes and should be a goal. Recent trends in smart metering technologies have resulted in utilities placing large investments in these systems, but do not necessarily have the commensurate improvement in efficiencies. Investment in metering systems within the context of Figure 1 presumes that the data is converted to information and knowledge that results in actions that improve efficiencies. There is also the risk that there could be an escalation in the cost of materials(i), manufacture(ii) and supply(ii) of components used in smart metering systems (The Economist, 2021), which will have an adverse influence on the cost of data.
Figure 1: Optimal level of data - efficiency versus cost (Johnson, 2009)
Anomalies in this data add to its costs, especially when sub-optimal decisions that are based on this data result in unwarranted operational, maintenance and capital expenditures. Anomalies in data therefore ultimately equate to inefficiencies. Abstruse technological aspects can also adversely affect the performance of the asset, for example reduce the battery life of the smart meter. This paper focusses on selected examples of unusual and abstruse technological aspects that could introduce risks of metering anomalies and associated data, that could ultimately inhibit decisions.
Methodology
Smart water metering system traditionally consists of two general categories, namely Automatic Meter Reading (AMR) and Advanced Metering Infrastructure (AMI) that transmit and/or receive data from remotely located meters. AMR reads meters remotely over a short distance, utilising portable electronic devices while walking or driving past the meter. AMI reads meters remotely over medium to long distances, utilising fixed communication assets that are either owned by the utility or a telecommunications company. Errors are introduced through the various stages of the pathway (i.e. chain) that the data progresses from its monitoring, capture, conversion, transmission, manipulation and reporting, as illustrated in Figure 2 (Johnson, 2009). The initial part of the pathway/chain has characteristics of Operational Technology Systems (also known as Industrial Control System, ICS) and the latter part of the pathway/chain, of eCommerce Systems (also known as Information Technology). The sequence of the assessment of the components of the pathway are from monitoring through to application (i.e. ‘bottom-up’). This is because it accurately defines the type of data, amount of data and suitability of its application that can be attained with available technologies. The alternative ‘top-down’ assessment (i.e. from application through to monitoring) could result in specifying a data-rich solution that cannot be attained with current smart metering technologies. Many of the benefits of smart water metering systems can only be realised when the complete data pathway/chain is implemented.
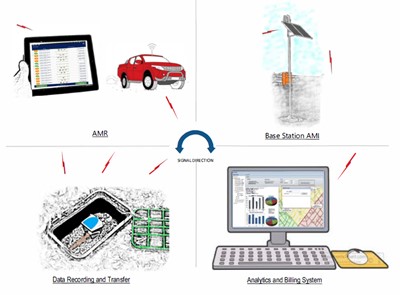 Figure 2: Data pathway/chain (Johnson 2009)
Smart water metering system traditionally consists of two general categories, namely Automatic Meter Reading (AMR) and Advanced Metering Infrastructure (AMI) that transmit and/or receive data from remotely located meters. AMR reads meters remotely over a short distance, utilising portable electronic devices while walking or driving past the meter. AMI reads meters remotely over medium to long distances, utilising fixed communication assets that are either owned by the utility or a telecommunications company. Errors are introduced through the various stages of the pathway (i.e. chain) that the data progresses from its monitoring, capture, conversion, transmission, manipulation and reporting, as illustrated in Figure 2 (Johnson, 2009). The initial part of the pathway/chain has characteristics of Operational Technology Systems (also known as Industrial Control System, ICS) and the latter part of the pathway/chain, of eCommerce Systems (also known as Information Technology). The sequence of the assessment of the components of the pathway are from monitoring through to application (i.e. ‘bottom-up’). This is because it accurately defines the type of data, amount of data and suitability of its application that can be attained with available technologies. The alternative ‘top-down’ assessment (i.e. from application through to monitoring) could result in specifying a data-rich solution that cannot be attained with current smart metering technologies. Many of the benefits of smart water metering systems can only be realised when the complete data pathway/chain is implemented.
Identification of error sources and their influence on the uncertainty of the data used for billing, management, operational and planning purposes is essential. As interfaces between different systems, technologies and processes are a common source of data anomalies, the objective is to examine these various interaction points
along the data pathway/chain. This assessment is guided by a risk management process to assist a utility in formulating its position on a smart water metering solution. There is also a symbiotic relationship between the lifecycle of a metering asset and that of its associated data pathway. Hence, the accuracy of the data is also influenced by the condition and performance of the meter and its associated systems throughout its life.
The basis for the methodology applied here is the assessment of risks associated with smart water metering systems assisted by risk management guidelines (AS/ISO 31000, 2018), in conjunction with the previously discussed data pathway/chain. The methodology therefore includes risk identification, risk analysis and risk evaluation. These risks related to data and asset anomalies inhibit making optimal decisions regarding the technology and the suitability of the data derived from these assets.
The risk assessment process includes drawing on the experiences of several previous smart metering investigations/projects including, at the time of writing, the largest roll out of smart water meters with AMR and AMI capabilities in Australia (Bermad, 2019). This knowledge is complemented by the examination of published literature on the specific topics/issues addressed. These examples included projects with electronic modules attached to mechanical meters and solid-state electronic meters with integral loggers/transmitters.
Risk identification
The recognition and description of risks is an initial step towards achieving the corporate objectives associated with selecting, implementing, and operating smart water metering technologies. Specifically, the focus is on anomalies in the system(s) that generate, transmit and apply the data, which could prevent achievement of corporate objectives. These anomalies include those sourced in the specification, design, manufacture and/or application of the assets and their associated data.
Risk analysis
Water metering and associated systems are complex and technological advances in digital electronics have increased these complexities while simultaneously simplifying their use for the end-user through greater functionality. These complexities can intentionally or unintentionally hide potential sources of asset and data anomalies. Qualitative and quantitative techniques are employed or referred to in assessing potential risks together with the nature and magnitude of the consequences. The interconnectivity of the data pathway/chain requires careful consideration when assessing potential risks, because an anomaly during the capture of data will impact the results achieved at the end of the chain.
Risk evaluation
Risk evaluation facilitates decision making by emphasising the requirements for additional action, further risk mitigation measures, and/or whether the original objectives should be revised.
The overall ‘bottom-up’ approach can be summarised as follows:
Step 1
Apply the risk assessment process for the first segment of the data pathway that involves risk identification, analysis, and evaluation (e.g. monitoring).
Step 2
Undertake a risk identification for the specific segment of the data pathway through an application of previously acquired knowledge and/or a focussed literature review. The pathway segments include monitoring, capture, conversion, transmission, manipulation, and reporting. A small sample of abstruse technological items is considered for that segment of the pathway and their associated risks are identified. The number of technological issues that can be addressed here is dictated by publication word limits.
Step 3
Undertake analysis, or quote analysis by others, of the previously identified risks employing, where applicable, qualitative and/or quantitative techniques. This includes consideration of previously-published findings relevant to each of the risks identified.
Step 4
Identify general risk mitigation (e.g. treatment) strategies from the perspective of internal and/or external stakeholders.
Step 5
Apply the risk assessment process to the next segment of the data pathway and then repeat the process, from Step 2 until completion of the risk assessment, for all segments of the data pathway.
Results and discussion
The deployment of digital metering across GWMWater’s operational area has resulted in significant benefits to the organisation and customers and provides opportunities and learnings for other water corporations and organisations to use Internet of Things (IoT) technology to improve efficiency and customer experience.
Monitoring of water
The basis of smart metering is metrology because it is the commencement of the data pathway as well as the basis of a smart metering system. Meters that are ‘used for trade’ (i.e. custody transfer) in Australia are required to comply with the provisions and requirements of the National Measurement Act (1960), as administered by the National Measurement Institute specifications (NMI-R 49, 2009), in conjunction with Australian Standards AS3565 (2010). The core of the Australian NMI R49 specifications is the European OIML R49 (2013) specifications. National or international metrological standards provide a suitable reference for specifying the metrological requirements. However, with the advent of advanced solid state digital electronic metering technologies, they do not necessarily account for all the benefits and limitations of a particular meter or its related systems. Selected examples of metrological aspects relevant to standards that have the potential to introduce anomalies in the data derived from the monitoring of flow through the meter are identified as follows:
- R-ratio or turn-down ratio
- Digital meter’s flow rate sampling (or scanning) ability
R-ratio
If the flow range of the meter is insufficient to match the water usage pattern of the customer, this results in non-registration and/or inaccurate volumetric measurements. The metrological quality of a meter is defined in terms of a ratio (R), which is the permanent flow rate (Q3) divided by the minimum flow rate (Q1). Installing meters with larger flow range capabilities (i.e. R-ratios) provides an intervention that minimises non-registration and minimises the adverse effects of incorrect meter sizing, and hence identifies a potential source of risk. Advanced digital metering technologies can have R-ratios that are nearly ten times greater than the older mechanical metering technologies.
An example of the analysis and evaluation of the potential risk associated with the R-ratio of two types of meters is illustrated through an improvement in billed volumes. Johnson, et al (2018) provides an example in Figure 3 of how increased billed volumes resulted from the installation of digital electronic (static) meters to replace mechanical meters. Although the average rainfall increased by approximately one third after the installation of the solid state (static) electronic meters, the billed volumes in this example also increased by approximately 8.1%. This is contrary to expectations, as increased rainfall would usually result in a decrease in external water usage which, if this was the actual situation, the improvement in billed volumes would be greater than 8.1%. It is recognised that other factors could have influenced changes in usage such as those due to water usage behaviours, unoccupied residences, occupation of new residences, etc. These factors were, however, assumed to have negligible impacts on the results because of the context of the particular environment and economic circumstances of the pilot areas. This assumption is subjected to scrutiny as part of a risk mitigation strategy. Under-registration due to measurement error decay was estimated using the results of a previous analysis of a statistically significant sample (Johnson, 2019) and is contributing to approximately half of the 8.1% billed volumes. New digital electronic (remnant magnetism) meters with 1:800 R-ratios (or R800) replaced the older mechanical meters that resulted in increasing the non-registration component of the bill volume (e.g. by half) and could be attributed to the greater R-ratio. In other words, the risk of non-registration by mechanical meter’s lower R-ratio was estimated at approximately 4.0% of the billed volumes as determined from their replacement by new digital electronic (static) meters with 1:800 R-ratios (or R800).
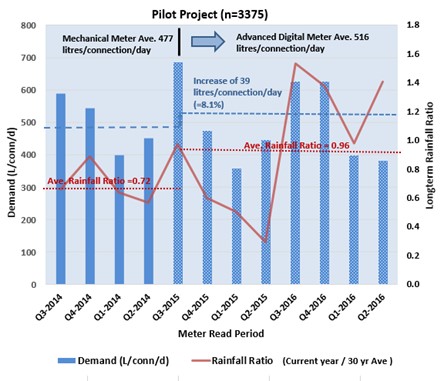 Figure 3: Billed Volume versus Meter Technology (Johnson, et al, 2018)
The potential for remote meter reading technology fitted to existing mechanical meters to change water-use behaviour has been previously investigated for 630 households in Sydney (Davies, et al, 2020). However, as the metrology remained unchanged, any impact on the before and after recorded usage can be reasonably assumed to be unaffected by the metrological quality of the meters. Hence, any benefits cannot be attributed to the R-ratio because it remains unchanged, as it involved the attachment of an electronic module to the existing mechanical meters to make them ‘smart’.
Risk mitigation (i.e. treatment) strategies related to R-ratios for meters could include the following:
- Installation of proven digital electronic (static) meters with the largest R-ratio.
- Trial digital electronic (static) meters with large R-ratios by installing in series with existing in-service mechanical meters. Monitor over several periods of varying (e.g. seasonal) usage and comparing their resultant totalised measured volumes over a year.
Flow signal sampling frequency
Short duration water usage events within a property, such as operation of a tap, are not necessarily accurately measured by a meter. The accurate sensing/monitoring of the movement of water that occurs within short discrete intervals is dependent upon the type of measuring technology employed. This in turn facilitates identifying the risk associated with a particular technology. Positive displacement mechanical (e.g. piston) meters are suited to accurately sense/monitor the movement of water that occurs in individual intervals of less than 10 seconds (Benková, 2014). However, specialised electronic data loggers connected to these meters and associated software are still required to record and analyse these short events (Arregui, 2015).
Ultrasonic digital electronic meters derive flow rates and volumes indirectly from measurements of the time differences between acoustic waves transmitted across its measurement section within which the water is flowing. Electromagnetic meters generate a magnetic field across the measurement section, which is continuously changing polarity and amplitude proportional to the field strength resulting from the variability of the flowing water. To conserve energy and maintain battery life, these digital electronic meters do not continuously measure the flow or excite the electronics to compute the require measurements. They instead take samples at periodic intervals. The flow signal sampling frequency of digital electronic meters generally vary between once every six seconds (i.e. 0.17 Hertz) and once every 0.5 seconds (i.e. 2 Hertz), depending on the principle of measurement.
Analysis and evaluation of the potential risk associated with measuring intermittent flows typical of residential customers has been assessed on a built-to-purpose flow test facility. The metrological performance of twenty-eight commercially available solid-state water meters from six different manufacturers as well as seven traditional mechanical meters from two manufacturers, were assessed (Arregui, et al, 2020). These results indicate that battery-powered ultrasonic meters are less suitable for accurately sensing the intermittent flow (i.e. periodicity) and variability of water usage events because of their low signal sampling frequency. However, the electromagnetic (remnant magnetism) meter was the most accurate across the test scenarios. Arregui et al (2020) conclusion includes the statement that “ultrasonic meters tested were more adversely influenced than the electromagnetic meters examined, mainly because the latter sample the flow signal more frequently and are, therefore, more adaptable for measuring short duration consumptions such as those found in households.”
Summarising the importance of these findings is that when operating within the lower flow range under intermittent flow conditions, ultrasonic meters are more likely to exceed the error limit requirements of metrological standards. However, the electromagnetic (remnant magnetism) meter tested under these conditions, generally comply with the requirements of these standards (Arregui, et al, 2020, Supplementary material)
Risk mitigation (i.e. treatment) strategies related to flow signal sampling frequency for meters could include the following:
- Installation of proven digital electronic (static) meters with flow signal sampling frequency equal or greater than 2 Hertz.
- Trial digital electronic (static) meters by installing in series with existing in-service mechanical meters over several periods of varying (e.g. seasonal) usage and comparing their resultant totalised measured volumes over a year.
Capture and conversion of data
The type of data captured by a meter is dependent upon the capabilities of the asset itself, the previously discussed metrological aspects, and the requirements of the next stage of the data chain. Selected examples of the capture and conversion of data by the meter that have the potential to introduce anomalies in the data are as follows:
- Conversion to electronic signals
- Local data storage within the meter
Conversion to electronic signals
Achieving a particular utility’s smart metering objectives might require the use of mechanical meters combined with electronic data loggers/transmitters. A potential weak link for those technologies is a device that is required at the interface between the electronics and the mechanical meters to convert the mechanical movement of the meter to an electronic signal for storage and transmission. An example of error introduced from the conversion of mechanical meter totaliser to an electronic reading by means of a commonly adopted reed switch pulser, is illustrated in the example in Figure 4. This fleet experienced a compounded growth in these random errors of approximately 1.5% per year. These errors are introduced when the reed switch generates artificial electronic pulses that are not the result of the mechanical movement of the meter and are commonly known as ‘bounce’ (Arregui, et al, 2006).
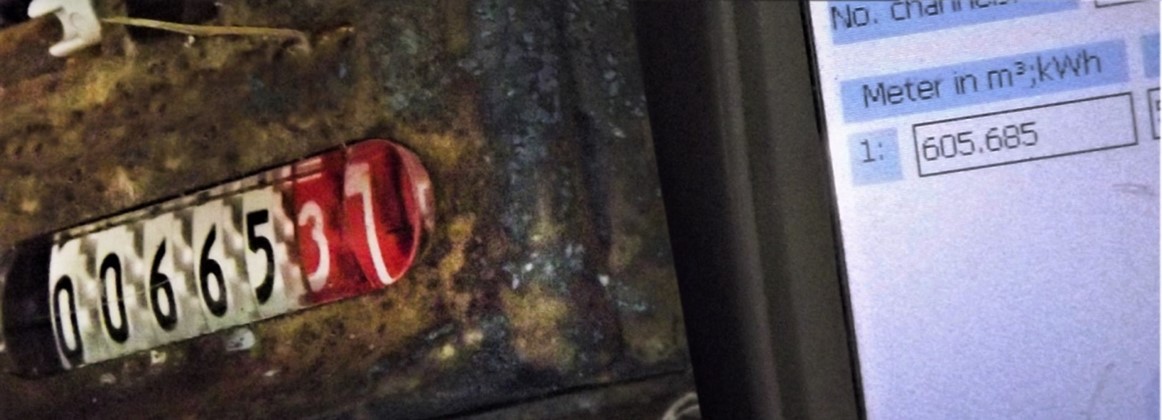 Figure 4: Example of meter read errors due to reed switch errors (comparison of mechanical meter totaliser on left with its remote electronic read on right)
Some vendors attempt to minimise reed switch bounce errors associated with their technologies using electronic noise filters or software, whereby the discrepancy between the desired signal and the switch bounce is disregarded or filtered out. However, the impact of risks associated with these solutions also require assessing. A risk mitigation (i.e. treatment) strategy includes the use of the Hall effect or magnetic inductive type sensors/emitters that are more stable and accurate than reed switches. An alternative strategy would be the installation of solid state digital electronic meters, which do not require conversion of mechanical movement to electronic signals.
Local data storage within the meter
If a smart meter has no electronic data storage capacity at the meter it relies on the prompt transmission of the signal generated by the meter to the next stage of the data chain, otherwise any break in the signal chain will result in the loss of data. This is especially a risk in geographically isolated sites and regions experiencing extreme climatic events, were even where the ground-based assets of satellite communications systems can be interrupted. Interruptions in transmission can also occur when multiple meters together with other IoT devices are attempting to transmit their signal simultaneously on the same frequency. In addition to the previously discussed accurate sensing/monitoring of the movement of water that occurs within short discrete intervals, the meter integrates these values to a pre-set monitoring interval for the transmission and/or storage of data. As an example, the sampling scanning frequency by an electronic static meter of the flowing water might be two Hertz, but the data can be processed and electronically logged every minute (i.e. a logging interval of one minute). Hence the sensitivity of the data stored is decreased as are opportunities for further sophisticated applications. The more frequently the meter stores data, the larger the amount of storage memory required. The logging interval required therefore determines the electronic data storage required at the meter and provides guidance as to how frequently transmission of this data should occur over the communications network. The utility needs to specify its logging interval requirements, which dictates the quantum (i.e. level) of data stored at the meter, as well as the recurrence interval for transmission of the data. This storage requirement is relevant to both electronic modules attached to mechanical meters as well as solid-state electronic meters with integral loggers/transmitters.
An example of data storage requirements for daily transmissions over the communications network, together with typical applications is provided in Table 1. If the meter is logging data every hour and is required to transmit daily over the communications network, then the meter’s data storage would be required to store at least 24 values before the memory exceeded its storage capacity. The risks of insufficient data storage include loss of data and restricted applications for which the data is used. A risk mitigation (i.e. treatment) strategy includes procurement of meters with sufficient data storage capacity. An alternative strategy is to only save key statistics such as the maximum, minimum and average values for a selected period to fit the limited storage available. However, this ‘filtering’ diminishes the quality and amount of data available for more detailed assessments (i.e. forecasting, time series and Fourier analyses).
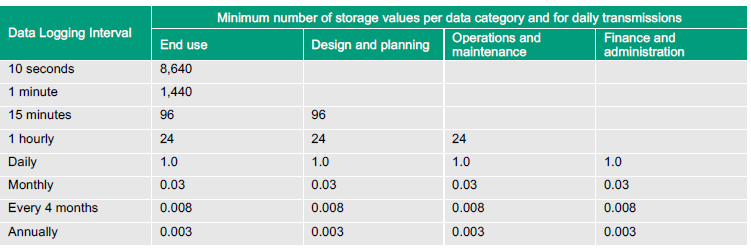 Table 1: Data Storage Requirements and Typical Applications
Transmission of data signal
Transmission and receipt of data can be broadly categorised in terms of the interrelated influencing factors of position, protocol and power. The position relates to factors that could influence the transmission of signals such as the position of the meter (i.e. endpoint) relative to other communications infrastructure. The directional capabilities of the communication flow relate to different protocols, and the power relates to energy required to transmit the signal. The impact that the transmission component of the data pathway has on the accuracy and availability of data is examined in terms its position, protocol, and power.
Position
Errors can be introduced into the data during the transmission of signals between the smart meters and communications infrastructure positioned at various sites. The risk identified relates to the signal adverse effected to such an extent that there can be a periodic loss or corruption of data. The signal link between smart meters and associated communication infrastructure can be adversely influenced by various factors that include the following (Johnson, 2009):
- Lengthy spacing between antennae causing signal diffraction loss because of the curvature of the earth.
- Interference in the signal due to reflections and blockages as the result of obstructions such as parked vehicles, buildings, a metal enclosure acting as a Faraday cage, and vegetation near and in the signal path.
- Signal reflections from the ground and water surfaces. An example is smart meters installed on or below ground that are periodically subjected to immersion due to heavy rainfall.
- The length of the radio link and characteristics of the geographical area can influence the propagation of the radio signal, as can climatic variations and rainfall intensity also affect the signal.
The effects of these factors can be limited through a planning and design process. The process can include establishing signal path profiles from signal link surveys and analysis however, signal path anomalies cannot be eliminated completely. The design of the communication network’s topology is aimed at ensuring reliable performance and greater fault tolerance through the signal coverage across the geographical area where the smart meters are installed. However, a service level performance of 100% meter reads, 100% of the time is generally an unachievable target because of variability in environmental conditions, limitations in technology costs, and the limit on the number of simultaneous transmissions from meters. Retransmission of signals could mitigate these technical challenges and improve performance. However, unlimited retransmissions can have an adverse effect on battery life, whilst delayed transmissions can result in the loss of data due to storage limitations. Noting that multiple service level performance requirements should also be specified for each stage of the end-to-end solution and not only for the telecommunications system.
Analysis and evaluation of the potential risk associated the performance levels of the telecommunications system are undertaken through the ongoing assessment of multiple parameters that include the following (Samitier & Mesbah, 2017):
- Availability – This is the probability of the proper operation of a network for a given information exchange (e.g. the percentage of time that the communications network can effectively relay data/alarms). This is also known as uptime and relates to the distribution, frequency, duration, and timing of service failures.
- Restoration Time – A time limit on service restoration following a communications network fault condition that depends upon the communication technology and topological complexity of the network.
- Service Integrity – The aptitude of the communication network to deliver the transmitted information without degradation, without loss, and without on-purpose alteration (e.g. capability of the network to deliver error-free data between network’s user interfaces).
- Survivability – The ability of the communications service to continue after a network infrastructure fault has occurred. This is essential to determine if a single fault in the reliability chain is likely to jeopardise the communications link.
- Time Latency (or delay) – The absolute delay introduced by the communication network into an application. Achieved time latency is relevant to the application and purpose of the smart metering technology.
Service integrity and time latency are particularly relevant to smart water metering regarding the impact of missing or erroneous data. A specific example of the impact that these parameters have is on the water balance calculated for a specified period. As a comparison, when manually (i.e. physically) reading a large cohort of meters, it is unlikely that all the meters will be read at the same time. It is usually possible to manually read the bulk supply input and bulk output meters at the same time, because they are fewer in number than the customers’ meters. Manual meter readings are usually carried out over a period of several weeks. Meter reading lag errors generate discrepancies in the calculation of the water balance and associated water loss indicators. Implementation of remotely read smart meters can reduce these lag errors. However, timing errors in the electronic logging of the measured flow and time latency due to the limitation in the number of meters that can transmit simultaneously over the telecommunication system, prevent elimination of all data anomalies. As a risk mitigation (i.e. treatment) strategy, the regularly remote updating of the solid-state meter’s electronic clocks are undertaken through their synchronisation. This ensures that all water volumes can be compared to common time reference that improves the accuracy of the volumetric amounts derived from multiple meters. Noting here the subtle difference between time stamping and synchronisation of the transmission signal and that of the originally recorded data in the meter. Remote synchronisation of the time stamp of data capture in the meter utilising one-way communication protocol is not possible.
Protocol
Data communication protocol architectures are sets of established rules that dictate how to format, transmit and receive data so a network of communication devices can communicate, regardless of the differences in their underlying infrastructures, designs or standards. A European standard has been developed for networking and remote reading of utility meters with new AMI and is known as the Wireless M-Bus protocol (EN13757.4, 2019). Wireless M-Bus is relatively simple compared to other metering protocols with the following benefits (Mohan, 2020):
- Star network (i.e. spoke hub distribution)
- No intellectual property (IP) limitations
- Long range
- Efficient transfer of data over the bandwidth (i.e. spectrally efficient)
- Lower cost
- Multiple suppliers
Data communication protocols can also be considered according to the direction of their signal transmissions as follows:
- Two-way communication protocol (i.e. bidirectional) – The information can be transmitted in both directions, from the meter to associated communication infrastructure and vice-a-versa. Normal operations of the meter will only transmit data after the receiving/relay communication infrastructure have requested the meter to provide its data. Two-way protocols allow for remote programming of meters and are more flexible. However, they are power hungry, which can result in reduced meter battery life if the regularity of transmissions is not limited.
- One-way communication protocol (i.e. unidirectional) – The information only travels from the meter to the associated communication infrastructure, without any feedback. Once the meter is installed the registered volumes and other status data are sent periodically regardless of whether the remote reading system is receiving data or not. One-way protocol weaknesses are the inability to be interrogated remotely back to the meter or to remotely update the meter’s firmware.
- One-and-halfway communication protocol – Also known as Listen-After-Talk protocol, because it transmits a single (uni) directional signal every 15 seconds and only opens for interrogation (bi-directional) signals every fourth emission (as an example). This protocol is more energy efficient, has a faster data transfer than other types of protocols and has good signal penetration when transmitting small data packages.
Power
Communications systems for smart water metering generally operate in the approximate frequency range of 160 to 933 MHz (megahertz), in the power range of approximately 10 mW (milliwatt) to one W (watt) and varying in license and unlicensed spectrums. The higher the power, the greater the penetration and coverage of the transmitted signal. The class license regime, operated on a shared basis that does not involve licensing fees, is defined in Radiocommunications (Low Interference Potential Devices) Class Licence 2015 or LIPD licensing by the Australian Communications and Media Authority (ACMA). The license free frequency spectrums differ for different countries.
The following examples illustrate the influence of radio frequencies, power, and protocols on the ability of signals to penetrate obstructions in or near its path. Transmission of small data packages (i.e. stack size) on a 433 MHz AMR system, with 0.25 W power and a listen-after-talk protocol provides good penetration over short distances. Transmission of small data packages on a 169 MHz AMI system, with 0.25 W power and a listen-after-talk protocol provides good penetration over medium to long distances. Transmission of small data packages on a 900 MHz AMI system, with one W power and a two-way protocol provides good penetration over long distances.
Manipulation and reporting
The existence of information differentials within a utility can diminish the creation of new knowledge (Johnson, 2009). Accessibility by all within a utility to both raw and processed data minimises these information differentials. This ideal of universal accessibility and comprehensive knowledge is examined in terms of cyber security of smart water metering systems.
Cyber security
Cyber security refers in general to methods of using people, process, and technology to prevent, detect, and recover from damage to confidentiality, integrity, and availability of information in cyberspace. Technologies required to support confidentiality, integrity and availability are often at odds with each other (Bayuk, et al, 2012).
Cyber security risks require consideration of all stages and components of the smart metering data pathway/chain, which integrates characteristics of its initial Operational Technology (or OT) components of the cycle with that of the latter eCommerce (or IT) component of the cycle. The protection from ‘denial of view’ (or control), which might not be malicious, is more important to OT, whereas the ‘denial of service’ and protection of information from a malicious origin is important to IT systems. Traditionally OT and IT networks were separated. However, advancements in technology has resulted in their increased integration, which brings about an increase in security risks (Hassanzadeh, et al, 2020).
Vulnerabilities identify potential cyber risks
Specifying, testing, and procuring smart metering systems that contain digital electronic integrated circuits (IC) requires identification of potential risks such as in-built Trojan-horse logic. A Trojan horse is a type of malicious code that is designed to inflict some harmful action on data or network. Remote-Access Trojans enable attackers to remotely control the victim’s computer systems as well as harvest confidential information. The design, manufacture and testing of ICs are generally undertaken by several international organisations, which provide a potential opportunity to insert Trojan-horse logic. Trojans can also infect a victim’s computer system via downloads, worms, and viruses.
The following summarised cyber security vulnerabilities and attack paths have been identified for electrical smart metering (Tweneboah-Koduah, et al, 2018):
- Firmware and software misconfiguration with a cyber-attack on the device decreasing the system’s operation and reliability.
- Application service attack with a cyber-attack that compromises system applications (Web, Mobile, System, etc.), which are run on various components of the system.
- Denial of Service (DoS) with a cyber-attack on the network by destabilising the communications.
- Code execution with a cyber-attack on the web interface resulting from poorly configured interface design (e.g. from outdated API code).
- Memory corruption with a cyber-attack on the data integrity of the memory within the device or the communications gateway.
Electrical and water smart meters differ in their respective principle of operation, power sources and siting. Water smart meters differ in that they require their own internal power source and are generally installed at the boundary of a property however, both types can be subjected to similar cyber-attacks.
Cyber risk mitigation (i.e. treatment) strategies
Security tools, technologies and solutions require implementing through an integrated strategy. Hassanzadeh, et al, (2020) has identified how different security tools and solutions can be used to protect a typical water utility against intrusion attempts on OT and IT systems. However, aspects related to cyber security controls that are specifically relevant to smart water metering include the following selected examples:
- Technology can be used to provide pre-deployment detection of in-built Trojan-horse malicious logic embedded in silicon chips (Abramovici, 2009). Combining machine learning and data mining methods together with existing detection methods enhance the accuracy and efficiency in detecting malware, such as Trojans (Tahir, 2018).
- The typical standard used for smart metering is a 128-bit encryption code (AES, 2001). However, an exponentially-more powerful 256-bit encryption can be used but it has a potential negative impact on power usage and speed.
- OT vulnerability tools are available that are machine-learning based, detect malicious configuration changes, identify unauthorised network scans, and identify new malware (i.e. zero-days)
- To minimise the adverse effects that a ‘denial of view’ would have, the following interventions should be considered:
- Ability of technology to re-route communication transmissions (e.g. increase reliability through employment of backup equipment).
- Substitute access to source data using different but compatible technology (e.g. ensure diversity such that failure of the permanent AMI fixed network can be substituted with a temporary AMR drive-by system until the fault is rectified).
- Range checks to identify zero or negative reads and maximum values (e.g. containment of superfluous values).
- Storage of data at the meter to prevent loss should communications failure occur (e.g. system resiliency).
Metering management software is interconnected to multiple IT systems such as those related to billing, customer web portals, asset management and event management. Interfaces between various eCommerce (i.e. IT) infrastructure, the OT, online services, and outsourcing arrangements include firewalls, Virtual Private Networks (VPN) and Application Programming Interfaces (API). It is important that strong cryptography is used for these interfaces as they are part of the attack paths for cyber-crime.
Mitigation of cyber security risks for the full end-to-end system includes the implementation of security barriers, user authentication, identity management, intrusion detection, encryption, disabling unused ports, restricting remote configuration and network security, guided by the organisations security policy.
Summary and conclusion
There are numerous potential benefits of implementing digital metering systems for both the utility and its customers. Making an informed decision as to which system to adopt requires uncovering potential asset anomalies and sources of data errors as well as losses associated with the various smart water metering technologies. The provision of information that is beneficial for a water utility should be consciously implemented rather than just allowing it to happen. Selected examples of unusual and abstruse technological aspects that could potentially introduce anomalies in smart metering assets and its associated data, are examined within the framework of a data chain/pathway. The following risks have been assessed for various components of a smart metering system’s data pathway:
- The adequacy of the flow range over which the meter operates and flow signal sampling frequency to minimise non-registration and/or inaccurate volumetric measurements. This also relates to the adequacy of the meter to accurately measure short-duration water usage events as well as low levels of leakage within a property.
- Anomalies introduced by some interfaces between the electronics and mechanical meter’s mechanisms as well as data storage limitations in the meter. This relates to the type of application that the data can be used, the type of technology required, and the specified level of reliability.
- The periodic loss or corruption of data during transmission of the signal due to positioning of telecommunications infrastructure, the directional capability of the communications protocol and radio power limitations. This relates to the current telecommunication regulatory requirements, the number of IoT devices transmitting simultaneously and implementing the system that is best suited for the specific operating environment.
- Cyber security risks over the full end-to-end system. This relates to ‘denial of view’ (or control), denial of service’ and protection of information from both malicious and unintentional origins.
The various technologies required for each component of the data chain and the multiple interfaces through which the data is filtered, condensed or altered, impose limitations on the amount and quality of data that is ultimately made available for use by the utility. The perception that implementing smart metering automatically results in a data-rich situation and optimal information is not necessarily correct. For example, if the meter is logging data every hour and is required to transmit daily over the communications network, then the meter’s data storage would be required to store at least 24 values before the memory exceeded its storage capacity. Delays in transmission of greater than 24 hours would result in lost data. Limiting the logging of data to a minimum period of one hour will restrict the suitability of the data for various applications, which could require reassessing in terms of the corporate objectives.
The process of selecting a smart metering solution that best meets corporate objectives requires a compromise because of current technology developments, regulations, and the relevance of applicable standards. Unusual and obscure technological aspects that could pose the greatest risk of introducing anomalies in smart metering assets and its associated data are assessed. Examining a selected sample of these technological aspects within the holistic framework of risk assessment and components of a generic data chain/pathway, have identified anomalies that appear to be seldomly addressed in literature. This ‘bottom-up’ approach is technologically agnostic and can also be applied to future technological developments in any components of the chain/pathway. Highlighting these technological aspects have facilitated the identification of risk mitigation (i.e. treatment) strategies aimed at reducing or eliminating the impact of these anomalies.
Acknowledgements
The following reviewers are gratefully acknowledged for their critique of this paper:
- Associate Professor N (Nina) Evans PhD, professorial lead in Science, Technology, Engineering and Mathematics (STEM), University of South Australia
- Professor JE (Kobus) van Zyl Ph.D., Watercare Chair in Infrastructure, Department of Civil and Environmental Engineering, University of Auckland
About the authors
Edgar Johnson | Edgar is a professional engineer with more than 35 years of Australian and International experience in water management. His education combines a Doctor of Technology with a commerce degree, providing him with unique insight into the full range of utility system practices. He has developed standards and guidelines associated with water loss management, efficiency and metering and has published more than 30 related articles/papers/research books. His involvement with the International Water Association (IWA) Water Loss Specialist Group included leadership of its non-revenue water apparent loss (AL) initiative. Recipient in 2016 of GHD Chairman’s Award for Global Technical Excellence. He was selected as one of 30 of Australia's Most Innovative Engineers by Engineers Australia in 2017. He is currently a Senior Technical Director: Water Efficiency at GHD.
References
Abramovici, M. (2009). Protecting integrated circuits from silicon Trojan horses. DAFCA, Inc February 10, 2009 https://militaryembedded.com/cyber/encryption/protecting-circuits-silicon-trojan-horses
Advanced Encryption Standard (AES, 2001). Federal Information Processing Standards. Publication 197, November 26, 2001.
Arregui, F. Cabrera, E. & Cobacho, R. (2006). Integrated Water Meter Management. IWA Publishing. (ISBN:1843390345).
Arregui F. J., Pastor-Jabaloyes L., Mercedes A. V. & Gavara F. J. (2020). Accuracy of solid-state residential water meters under intermittent flow conditions. Multidisciplinary Digital Publishing Institute (MDPI ).Basel, Switzerland, https://www.mdpi.com/1424-8220/20/18/5339/htm (including clarifications from Arregui provided to the author in email dated 7 September 2020)
Arregui. F. (2015). New Software Tool for Water End-use Studies. IWA Efficiency Conference. Cincinnati. USA.
Australian Standard AS ISO 31000 (2018). Risk management – Guidelines. SAI Global Pty Ltd. ISBN 978 1 76072 205 0
Australian/New Zealand Standard AS/NZS 3565.1 (2010).Meters for cold and heated drinking and non-drinking water supplies. Part 1: Technical requirements.
Benková. M. (2014). Experimental tests for determining water meter compliance with MPE during step flowrate interruptions. Czech Metrology Institute (CMI), Czech Republic (Report reference numbers 13601504 and 13601502).
Bermad Metering Technologies (2019) The iPerl Metering Rollout with TasWater. https://www.youtube.com/watch?v=IbpTLc-hW74
Bayuk J.L., Healey J., Rohmeyer P., Sachs M.H., Schmidt J. & Weiss J. (2012). Cyber Security Policy Guidebook. John Wiley & Sons, Inc. ISBN 978-1-118-02780-6
European Standards EN 13757-4 (2019): Communication Systems for Meters-part 4: Wireless M-bus Communication
Hassanzadeh, A., Rasekh, A., Galelli, S. & Aghashahi,M. (2020). A Review of Cybersecurity Incidents in the Water Sector. Journal of Environmental Engineering. Vol. 146. Issue 5.
Johnson, E.H. (2009). Management of Non-revenue and Revenue Water Data. Engineers Media, Australia. ISBN 9780858258839 (2nd Edition).
Johnson, E.H. (2019). Enhancing Water Meter In-service Testing and Replacement Decisions. AWA Water eJournal. Vol. 4 No.1. https://watersource.awa.asn.au/business/assets-and-operations/enhancing-water-meter-in-service-testing-and-replacement-decisions/
Johnson, E.H. & Savage, R. (2018). Integrated Data and Asset Management Approach Identifies Optimal Level of Data Improving Water Supply Efficiencies. AWA OzWater’18 Conference. Brisbane
Monks I., Stewart, R.A., Sahin O. and Keller R. (2019). Revealing Unreported Benefits of Digital Water Metering: Literature Review and Expert Opinions. Water 2019, 11, 838; doi:10.3390/w11040838. www.mdpi.com/journal/water.
Movan, V. (2020). An Introduction to Wireless M-Bus. Silicon Labs. http://pages.silabs.com/rs/634-SLU-379/images/introduction-to-wireless-mbus.pdf
OIML R49-1 (2013). Water meters intended for the metering of cold potable water. Part 1: Metrological and technical requirements. International Organisation of Legal Metrology.
Samitier, C. & Mesbah, M. (2017). Utility Communication Networks and Services-Specification, Deployment and Operation. Springer International Publishing Switzerland.ISBN 978-3-319-40282-6
Tahir,R. (2018). A Study on Malware and Malware Detection Techniques. I.J. Education and Management Engineering, 2018, 2, 20-30. Published Online March 2018 in MECS (http://www.mecs-press.net).
The Ecomomist (2021)(i) .Commodities – Twin peaks. February 13th -19th .Volume 438 Number 9232 pp 62-64
The Ecomomist (2021)(ii). Technology and geopolitics – Betting all the chips. January 23rd-29th. Volume 438 Number 9229. pp 8
Tweneboah-Koduah S., Quarshie Azasoo J., Tsetse T. & Endicott-Popovsky B. (2018). Evaluation of Cybersecurity Threats on Smart Metering System. https://www.researchgate.net/publication/318601090
Share