By J Barnes, J Todhunter and R Wong.
First published in Water e-Journal Vol 5 No 2 2020.
Abstract
With increased pressure on wastewater utilities to accommodate population growth and pursue lower nutrient discharge targets, it is important to better understand the social and economic impacts of these drivers. This will ensure that utilities continue to provide long-term sustainability, delivering value to its customers and communities.
Urban Utilities is working towards developing cost-decision making tools to allow the assessment of both environmental and economic impacts with regards to nutrient removal.
This paper looks at how Urban Utilities can use these concepts to identify the most cost-effective opportunities within the business to ensure the net effect is positive.
Introduction
Moreton Bay is an environmentally significant area that supports a vast array of marine life in South East Queensland (SEQ) [1]. Managing nutrient emissions from sewage treatment plants (STP), specifically nitrogen and phosphorous, therefore plays an important role in maintaining the health of the bay.
With expected population growth and changes to catchment characteristics such as industry loads and water use profile, utilities face an ever-increasing pressure on balancing nutrient emissions, operational costs and treatment capacity. Ultimately, these pressures are reflected in the cost to the customer for providing wastewater treatment services.
With these drivers, alternate nutrient management strategies and technologies are being sought to enable improved outcomes for Urban Utilities, its customers, and the environment.
In pursuing this, Urban Utilities is beginning to investigate strategies that integrate environmental economic concepts with current nutrient management practices.
The focus of these concepts is to understand the cost at the margin to perform nutrient reduction activities but also including the external costs created as part of that activity, often referred as Marginal Abatement Cost (MAC) and Marginal Damage (MD), respectively.
Ultimately, re-thinking the way Urban Utilities approaches sustainable nutrient management will allow for better informed decisions with respect to future capital upgrades and setting operational envelopes.
Background
Regulation requirements
Introduced in August 2016, the Bubble Licence (BL) was the first of its kind for the Lower Brisbane Catchment (Figure 8). Compared to traditional effluent limits for individual STPs, the permit allows Urban Utilities to operate nine STPs under a combined annual mass load for Total Nitrogen (TN) and Total Phosphorous (TP).
The implementation of the BL has since presented both a risk and an opportunity to achieve greater emission reduction by shifting attention from smaller, costly improvements across the other treatment plants to focusing on improving nutrient removal performance at larger sites.
Based on the current BL permit, TN is the limiting nutrient with respect to performance, accounting for approximately 78% of its mass load limit, while TP sits at 45%. Therefore, current load reduction activities are predominately focussed on improved TN removal.
Nutrient performance
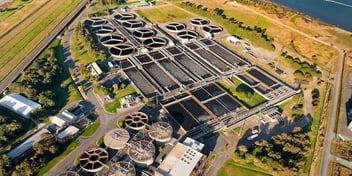
Luggage Point is Brisbane’s largest municipal wastewater facility, treating flows based on an equivalent population (EP) of approximately 750,000 EP.
Being the largest out of the nine STPs, this accounts for 64% of the overall TN mass load discharged under the BL (Figure 1); however, this is expected to increase to around 932,300 EP by 2042.
 Figure 1: Contribution of individual STP loads to overall TN mass load discharged
Due to Luggage Point’s significant contribution to the total mass load, its performance heavily influences the ability to meet regulatory limits. In context, improving effluent TN quality by 1mg/L from Luggage Point reduces mass load emissions by approximately 49 tons per year.
Since 2018, operational optimisation trials have been conducted on aeration performance and process control. Improvements in performance were observed through these trials, with the average effluent TN concentration reducing from 7.6 mg/L to 6.5 mg/L (Figure 2), resulting in a 53-ton reduction in annual TN mass load discharged.
With projected catchment growth in the coming years, continual performance improvements may be limited, and further work may result in diminishing returns.
Whilst there are options to meet the effluent targets through capital and operational investment, most of these traditional options conflict with the strategy of sustainable treatment due to an almost certain increased cost to the customer.
Figure 2: Luggage Point effluent TN quality improvements
Load management opportunities
Traditionally, opportunities to trial emerging operational strategies and technologies were limited under a typical site-based licence. The high compliance risk was viewed as intolerable due to the uncertainties around achieving TN discharge requirements for each plant.
The introduction of the BL has provided the flexibility and opportunity for Urban Utilities to explore a more wholistic nutrient management strategy between STP planning and operations.
A range of novel technologies can be trialled at the smaller STPs within the BL to greatly reduce the risk of exceeding the total mass load limits. Trials at these smaller plants provide a platform to build a strong understanding of the limitations and benefits of a technology at full-scale.
If proven successful, it provides the potential to fast-track the implementation of new operational strategies at its larger treatment plants where even greater benefits can be realised.
As a result, Urban Utilities have begun investigating alternative technologies and innovative operating processes, such as short-cut nitrogen removal, with the aim to reduce overall operating costs and unlocking process capacity of its treatment plants, altogether benefitting the triple bottom line.
Methodology
Marginal abatement cost & marginal damage assessment
Whilst the BL stands as an overarching nutrient management strategy, Urban Utilities is beginning to take further steps in trying to establish new cost benefit decision-making tools that allow nitrogen to be managed with respect to costs and benefits with respect to externalities.
Integrating environmental economic concepts such as marginal abatement costs and marginal damage costs are useful as a decision-making tool for comparing alternate options to achieve sustainable nutrient reduction.
These concepts can be used to evaluate the marginal cost of investing in conventional versus emerging technologies, allowing a unit comparison of both options to be made. For example, as a nutrient reduction option, investment in ethanol dosing can be compared to an anammox side-stream treatment process by comparing the marginal costs of each.
The lowest marginal cost at a given removal performance represents the cheapest removal technology. Additionally, the marginal damage cost can be included to assess how each unit of nutrient released produces externalities. When both factors are considered together, a true representation of the total costs can be established, including their sensitivity relationship to each other.
Marginal Abatement Cost (MAC) concept
The abatement cost in the context of wastewater treatment can be simply defined as the total cost to own and operate treatment technology to remove pollutants. These pollutants are typically nutrients and organic matter that, if untreated, would harm local waterways when released.
If abatement costs are the total pollution removal costs, then the marginal abatement cost (MAC) represents the change in cost to achieve the removal of one unit.
When assessing treatment options (existing or future), the marginal costs can be determined and a function can be developed to produce a curve, known as a Marginal Abatement Cost Curve (MACC).
Figure 3: MAC curve concept
As demonstrated in Figure 3, the cost to abate (or treat) is highest when the emissions released are at their lowest (point e1, c1). Conversely, an uncontrolled release (no treatment), e0, corresponds with the minimum cost, c0. Moving from right to left (up the curve) shows increasing costs to achieve pollution removal. Similarly, moving down the curve represents the cost saved by not abating pollution.
If several MAC curves exist (e.g. multiple treatment plants), then they can be aggregated to form an aggregate MACC. The aggregate MACC may be useful when viewing the whole of system to determine what the abatement costs are to achieve performance across a catchment, for example in a bubble licence scenario.
The MACC also shows how costs are distributed amongst different sources and gives insight into the respective performance costs of each treatment plant.
Furthermore, since the curve is a function, the area under the marginal abatement cost curve approximates the total abatement cost.
Marginal Damage (MD) concept
The MAC curve is an indication of the cost associated with the removal of pollutants. The concept demonstrated in Figure 3 gives consideration only to abatement cost and ignores any costs to the environment. If this cost is ignored, the environment effectively subsidises the cost of damage done by the remaining nitrogen emitted in the effluent.
In addition, each unit of pollutant removed results in an environmental benefit being accrued, that is, a reduction in environmental damage. The term ‘damage’ in this concept is defined as an externality (negative) that results from the pollutant release. Therefore, environmental damages avoided can also be viewed as environmental benefits gained [2].
The cost of these damages (and benefits) can be accounted for in a similar way to the MACC by the development of a marginal damage (MD) curve.
The MD curve is a representation of the damage occurring (as a cost to the environment) at each nutrient emission rate. Like the MAC curve, the MD is also a marginal function, meaning it represents the damage incurred as a result of each unit of pollution released.
Damage as a function is both time specific and can also be cumulative. This is an important consideration as is the assumption that damages can be reversed. Accounting for the distribution of damage over time is also important since some damages may occur in the future but due to emissions released today.
Determining the damage requires careful and measured consideration. Both market and non-market price assessments are typically required [2], and the uses of specific catchment associated values are critical in determining this.
Figure 4: MD curve concept
Figure 4 shows an emission release rate, e1, resulting in a marginal cost to the environment, c1. Again, the function is based on marginal increments, thus the total area under the curve represents the total value of damages done to the environment.
To develop an emissions damage function with respect to physical damages the following can be conducted:
- Emissions need to be measured and their fate and distribution modelled.
- The human exposure at each emission output needs to be estimated along with the physical impacts.
- The values associated with the physical impacts need to be estimated.
Making an estimate on valuation that considers restoration costs or abatement costs is rather physical and somewhat limited in its view. These types of direct estimates tend to undervalue non-market considerations and do not account for how people may change their behaviour to accommodate for damages.
Essentially, the benefits of something are assumed to be what someone is willing to pay. In lieu of a direct estimate, a willingness to pay (WTP) or willingness to accept (WTA) approach may be adopted [3].
This may be done via revealed preferences or stated preferences method. These methods inadvertently hold varying contingent bias so careful consideration needs to be taken on which approach is chosen. What someone would be willing to pay to avoid damages can be referred to as ‘averting costs’ and can be used in the assessment.
Surveys can also be conducted to determine what someone would be willing to pay to directly reduce the damage itself. This is referred to as a contingent valuation approach and any feature of the natural environment may be included in the assessment.
Figure 5: MD curves for various receiving environments or pollutants
Since the MD curve is a function of both the receiving environment and the pollutant of interest, the curve is prone to variability. Various MD curves can exist based on these factors (Figure 5).
Curve 1 indicates damages occurred as soon as emissions occur, representing an extremely sensitive environment with low assimilation capacity or a toxic pollutant.
Curve 2 demonstrates a receiving environment that becomes saturated with a pollutant. By understanding this function, a specific relationship between nutrient discharge and harm can be established.
Equimarginal point
By combining the MAC and MD curves (Figure 6), the intersection between the two is defined as the ‘Equimarginal point’ [2]. At this point, the marginal abatement cost (y axis) is the same as the marginal damage cost.
Additionally, the total cost of abatement (Area 1) and the total cost of damage to the environment (Area 2) are at a minimum and in some cases are an equal area. This implies that the cost to treat nitrogen is equal to the damages done to the environment by the remaining nitrogen loads released.
Figure 6: Equimarginal concept combining MAC & MD curves
In Figure 6, Area 1 represents abatement costs and Area 2 represents damage costs. The sum of these costs is considered the social cost and represents the process of internalising externalities. In an optimum scenario, the area that denotes the social costs should be at a minimum. This implies overall that both the money spent to abate, and the damages done by the residuals from the activity are socially efficient. This can thus be viewed as the socially efficient rate of pollution [2].
Moving further up the MAC curve from the equimarginal point represents a reduction in nitrogen emissions to the environment but at an expense of increased treatment costs. It is important to understand the implications of this as it may increase the overall social costs.
It may be viewed that going beyond (i.e. left on the MACC) past the equimarginal point signifies inefficiency. This would indicate that the additional cost don’t result in increased net benefits [2].
This could represent an opportunity cost whereby resources could be better allocated towards other activities that generate better net social and environmental outcomes. It is also worth considering what customers would be willing to pay to achieve this.
Concept application and results
Luggage Point STP upgrade strategy
Under a typical upgrade strategy, it is estimated that Urban Utilities would require extensive capital investment in excess of $180m to meet growth and nutrient reduction targets. With such significant forecasted spends, Urban Utilities have re-framed their approach to nutrient management by focusing on asset utilisation and intensification through nitrogen short-cut processes.
As part of the plan to increase Luggage Point STP’s capacity in line with expected catchment growth, anammox and nitrite shunt were identified as innovative and sustainable approaches with significantly reduced capital investment.
Under this upgrade strategy, Urban Utilities has been growing up anammox seed stock through a series of scale-up systems to facilitate the development of biomass for the full-scale process.
Urban Utilities is also in the process of establishing a nitrite shunt and simultaneous nitrification-denitrification (SND) trial at the Bundamba STP to investigate its potential application at Luggage Point.
Equimarginal analysis at Luggage Point
Luggage Point STP has six anaerobic digesters onsite for redirection of carbon via the production of methane for energy generation.
Whilst biogas utilisation provides significant benefit towards offsetting the plant’s total energy requirements, the return flows from the side-stream accounts for approximately 12 to 15% to the mainstream TN load and therefore contributes significantly to the plant’s operating costs and nutrient footprint.
Urban Utilities identified an opportunity to significantly reduce TN load to the mainstream process by treating the side-stream separately with anammox. This technology was selected due to its ability to short-cut the nitrogen cycle by oxidising ammonium directly to nitrogen using nitrite as the electron donor and without the need for an additional carbon source [4].
By taking advantage of this cost-effective biological process, it is more favourable than other capital or chemical intensive solutions such as ethanol dosing. In combination with nitrite shunt, future upgrades associated with forecasted population growth can be potentially deferred, resulting in significant capital savings.
Furthermore, the implementation of anammox also supports the importation of co-digestion products for increased gas and energy production to further offset plant energy requirements.
Figure 7: Anammox versus conventional MAC and MD curves for Luggage Point
Although side-stream TN loads are expected to increase with importation, efficient treatment through the anammox process ensures this strategy is sustainable on return loads for the mainstream process. This will further facilitate the path towards long-term sustainability, delivering value to its customers and communities by reducing the cost of nutrient removal and discharge to waterways.
Bringing the MAC, MD, and equimarginal point principles together, the benefits of the side-stream anammox treatment can be better understood (Figure 7). MAC Curve 1 represents ethanol dosing treatment whereas Curve 2 represents treatment with anammox.
This demonstrates that implementing anammox drives the MAC curve lower, shifting the equimarginal point, which results in both a marginal abatement cost and environmental harm reduction through lower nitrogen emissions. This illustrates the importance of investigating new and emerging technologies, such as anammox that have the potential to create improved social benefits.
Ultimately, this is an important link in establishing sustainable operation into the future as growth demands continue to present cost pressures.
Anammox scale up at Luggage Point
Urban Utilities is now in the final stages of the enrichment process with a new 50m3 reactor installed at the Luggage Point Innovation precinct in collaboration with Veolia (Figure 9).
The 50m3 biofarm reactor will ensure there is sufficient anammox biomass to transfer to the new tanks to be commissioned at the end of 2020.
At full-scale implementation, the anammox side-stream treatment process is expected to remove 85% of return ammonia loads to the mainstream.
The process is also expected to reduce overall operational costs of up to 60% when compared to conventional nitrification-denitrification processes [5], translating to an annual saving of up to $500k/year.
Nitrite shunt strategy
Due to the significant capital investment required under a traditional upgrade for Luggage Point, it is important to ensure that the future capital upgrades are properly informed to drive the best overall outcomes for Urban Utilities, its customers and the environment.
For this reason, Urban Utilities is strongly focused on the early investigation and knowledge development of emerging technologies to inform the business of more favourable solutions.
Under a new upgrade strategy for the mainstream treatment at Luggage Point, Urban Utilities is exploring new operating strategies to move from conventional nitrification-denitrification to nitrite shunt.
This process involves short cutting the nitrification process and, if successful, the technology would result in the combined benefits of reduced operational costs, improved removal performance (reduced emissions), and increased plant capacity (capital deferral).
As part of the new upgrade strategy, Urban Utilities is preparing to conduct a nitrite shunt trial at the Bundamba STP as a feasibility investigation for Luggage Point. Under the BL, this approach reduces the risk of any possible adverse outcomes from trialling nitrite shunt prior to implementing at Luggage Point.
The proposed trial will be tested on a reconfigured bioreactor with the aim to better understand the required infrastructure investment, instrumentation and control for its application at Luggage Point.
The Bundamba trial also serves as an engagement tool for upskilling plant operators, which is key for the rapid and successful deployment of new technologies.
Whilst the trial will be used as an investigative study for the upgrade strategy for Luggage Point, the proposed benefits of the trial will also enable Bundamba to defer capital expenditure through increased process capacity of current infrastructure.
This also includes an anticipated reduction of $40,000 per year in electricity costs (per bioreactor) due to the improved aeration efficiency.
Conclusion
In alignment with Urban Utilities’ environmental strategic goal, it is important to be able to identify the costs associated with achieving these nutrient reduction targets in conjunction with expected population growth.
Part of this process is to better understand the most sustainable path towards achieving this target. This will ensure that Urban Utilities will continue to provide long-term sustainability, delivering value to its customers and communities by identifying the most cost-effective opportunities to reduce nutrient discharge to waterways.
Finally, it is important to note that the environmental economic concepts explored within this paper are continuously evolving and therefore progressing as a decision-making tool.
Acknowledgements
Jason Dwyer, Paul McPhee, Simon Clements, Peter Donaghy and Sonja Toft.
About the authors
Justin Todhunter | Justin Todhunter has a Bachelor of Science (Hons) majoring in Microbiology and a Bachelor of Chemical and Biological Engineering. Justin currently works at Urban Utilities as a R&D Process engineer, working with pilot and full-scale installations with a focus on implementing new technologies. Justin has a broad range of experience as engineer, having worked in the Oil & Gas, Mining, Agriculture and Wastewater Industry.
Jamie Barnes | Jamie Barnes is a Process Engineer with Urban Utilities focused on treatment operations and project assurance activities. Jamie is currently completing post graduate studies in Environmental Engineering adding to previously completed undergraduate studies in the same field.
With a background in government since 2012, Jamie has worked on both potable and wastewater treatment processes in three different local government entities across quality, environment and operational streams. More recently, Jamie has been active in assisting Urban Utilities to develop new methods respect to the assessment of marginal costs and damages in the project evaluation phase.
Reece Wong | Reece Wong is a Process Engineer in Operations and Service Delivery at Urban Utilities. Since joining Urban Utilities in 2017, Reece has worked in treatment operations, focusing on process performance improvements and optimisations across multiple urban and regional wastewater treatment plants.
References
Department of Environment and Science. Moreton Bay Marine Park, (2019) Retrieved from: https://parks.des.qld.gov.au/parks/moreton-bay/culture.html
B. C. Field & M. K Field. Environmental Economics 7th Edition. (2016).
M. Bijleveld, S. de Bruyn, L. de Graaff, E. Schep, A. Schroten, R. Vergeer. Environmental Prices Handbook EU28 (2018).
M. Strous, E. Van Gerven, J. G. Kuenen, M. S, M Jetten. A. Effects of aerobic and microaerobic conditions on anaerobic ammonium–oxidising (anammox) sludge. Applied Environmental Microbiology 63. (1997), pp 2446 – 2448.
S. Lackner,, E. Gilbert, S. Vlaeminck, A. Joss, H. Horn, & M. Van Loosdrecht. Full-scale partial nitritation/anammox experiences – An application survey. Water Research 55, (2014), pp. 292- 303.
Share