By M van Bueren and R Blamey.
First published in Water e-Journal Vol 4 No 4 2019.
Abstract
With a drying climate, Perth is facing difficult decisions about how to manage green public open space (POS) in the metropolitan area. At present, local councils irrigate POS with groundwater. But this resource is becoming depleted owing to reduced recharge, prompting the state government to consider reducing licensed allocations. In this study we use a choice modelling survey of 525 Perth households to assess whether community is prepared to pay for more expensive sources of irrigation water to keep POS green over summer or, alternatively, are willing to make compromises – e.g. less green space, replacing grass with native groundcover, or improving public park facilities. The aim of the study is to understand how local councils and government should best respond to reduced groundwater availability.
Introduction
To our knowledge, this is the first time that choice modelling has been used to evaluate community preferences and values for alternative attributes of green POS. The study focuses on how people value different management outcomes for public parks and median strips, including changes in the area of grass kept green over summer, increases in native groundcover, and improvements to park facilities (such as shade shelters, picnic facilities and playgrounds).
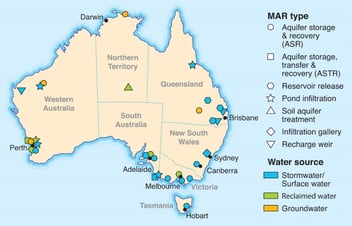
Groundwater is an important source of urban water supply for metropolitan Perth and is the primary source of irrigation water for public parks. But groundwater resources are coming under pressure through a combination of increasing demand and lower recharge, due to climate change. For example, the Gnangara groundwater system just north of Perth has come under increasing stress over the last 40 years or so as Perth’s annual rainfall has progressively declined. As inflow to dams decreased in the 1980s, 1990s and 2000s, groundwater was increasingly used to supply Perth’s drinking water, while also maintaining supply for local, non-potable uses such as agriculture and irrigating POS.
By 2001, the ongoing effects of a drying climate, together with progressively higher abstraction, had resulted in a deterioration of water quality, falling groundwater levels, and subsequent adverse impacts on the environment (DWER, 2019A). In response, the Department of Water and Environmental Regulation (formerly Department of Water) largely capped licensed groundwater abstraction in 2009 , and the amount of water taken for public water supply was progressively reduced as alternative, climate-independent sources were developed.
Notwithstanding these response measures, further reductions in abstraction are deemed necessary to restore the balance, as recharge remains low and may continue to decline (DWER, 2019B). The present policy challenge is to identify the least-cost means of reducing groundwater abstraction to sustainable levels.
One possible measure being considered as an element of a broader package of options is to reduce licensed allocation to councils for watering POS. In the Gnangara groundwater area alone, about 46 gigalitres, equivalent to 16% of all abstraction from the Gnangara groundwater system, is used for watering public parks (DWER, 2018). Therefore, a 10-15% cut in POS irrigation use could deliver considerable water savings.
But if the licence cuts result in less green POS, it is unclear what costs this would impose on the community. These costs are difficult to quantify because they are non-market impacts – for example, reduced enjoyment from using a park.
Previous economic valuation studies indicate that urban communities do value the benefits of green POS. For example, a study by Morrison and Mathieson (2008) found that the net social benefits of a 5% increase in green open space were worth between $1.4 million and $1.7 million ($2015-16) for the Ashfield and Mosman local government areas in Sydney, respectively. The benefits valued were environmental services, increased property values and reduced health issues such as obesity and depression.
Further evidence comes from a study by Ambrey and Fleming (2012), which found a positive relationship between the percentage of public green space in a resident’s local area and their self-reported life satisfaction. This Australian study, based on a survey of 6156 households residing in capital cities across the nation, found that on average, a resident has an implicit willingness-to-pay of $1,168 in annual household income for a 1% (143m2) increase in public green space in their local area.
In a more recent study, the CRC for Water Sensitive Cities (2017) has used a hedonic pricing approach and estimated that Australian households are willing to pay between 9% and 16% more for a house that has access to POS.
However, less attention has been paid to understanding what features of POS are valued by the public, their willingness to substitute irrigated grass for other forms of landscaping, and how values change ‘at the margin’ when POS is altered from its current form. Hedonic analysis is a relatively weak tool for understanding these marginal values and trade-offs because it relies on establishing a statistical relationship between observed property prices and proximity to POS. Choice modelling (CM) is a more suitable approach because it is specifically designed, through a controlled experimental framework, to assess how people make trade-offs between alternatives and the attributes (or features) that make up the alternatives. Further, it offers control over how alternatives are presented to survey participants, and enables future ‘what if’ scenarios to be assessed.
Method
CM is a well-established technique for valuing non-market benefits. It typically involves asking people a series of up to eight questions, each providing the respondent with a description of three alternatives and asking them to select the one they prefer. One of these alternatives, which is offered in each choice question, describes the outcomes under an existing management system (the ‘base case’ scenario). The other two alternatives describe outcomes resulting from management changes. Each alternative represents a package of outcomes defined in terms of 5 to 6 attributes. The attributes describing the management change alternatives vary from question to question in accordance with an experimental design, allowing the impact of different levels of outcomes to be tested.
The observed choices of alternatives are pooled across all respondents and a multinomial logit model is used to explain the statistical relationship between the choices and the attributes (together with other explanatory variables such as respondent demographics).
Base case scenario
In this study, the base case scenario was defined as having the following attributes:
- a 20% reduction in the proportion of green POS able to be kept green through summer (which is considered to be a plausible outcome given the scale of groundwater allocation cuts being contemplated);
- no conversion of grassed areas to native groundcover;
- two parks each year receive upgraded facilities (representing current practice); and
- no increase in council rates.
Other alternatives
We explained to respondents that instead of the base case, councils could maintain or increase the area of irrigated grass by switching to a different water source (e.g. potable scheme water or recycled water) or by investing in water efficient technologies. Alternatively, councils could replace some grassed areas with native groundcover that needs less water. Another response could be to ‘compensate’ for losses in grassed area with additional investment in facility upgrades (BBQs, shade shelters, playgrounds etc.). Respondents were advised that, unlike the base case, all of these options would involve a specified increase in council rates.
An example of how these choices were presented to respondents is contained in Figure 1. Different combinations of choice alternatives were defined by specifying particular levels for each of the attributes (see Table 1).
 Table 1: Attributes and levels
Figure 1: Example choice set
Table 1: Attributes and levels
Figure 1: Example choice set
Supplementary questions
Outside the CM framework, we also asked survey participants a number of supplementary questions about the things they most liked about their suburb; features they most liked about their local park; and changes that would make their local park more (or less) appealing. These questions were designed to help respondents reflect on the way they currently interact with POS in their local area, in advance of asking them to make choices between different management options. Further, the information gathered through these questions serves to contextualise the choice information gathered through CM.
Respondents were asked a combination of attitudinal questions, which captured responses on a five-point scale, and questions that allowed respondents to select their preferred item(s) from a list of possible answers. Examples of the types of questions asked are as follows:
- Thinking about your local parks and gardens, which of the following aspects do you value most about these areas? (please select your top five aspects from the list provided)
- Now thinking about the park you visit most frequently in your local area, how appealing would you rate it? (please indicate your response on a five-point scale ranging from ‘not at all appealing’ to ‘extremely appealing’)
- What activity do you enjoy doing the most when visiting this park? (select one activity from six possible options)
- What aspects do you value most in this park? (select multiple from a list of items)
- What changes do you think would make your local park more appealing to you? (please select your top five changes from the list provided)
- What changes do you think would make your local park less appealing to you? (please select your top five changes from the list provided).
A complete copy of the questionnaire is available from the authors, on request.
Survey administration
The survey was administered as a web-based questionnaire, with recipients recruited through an internet panel. Eligible recipients for the survey were screened as follows: They had to live in the Perth metropolitan area, be aged 18 years of age or over, and own the home they live in, with or without a mortgage. The data was weighted to ABS statistics for age, gender, tertiary education and full-time employment status, within the Greater Perth Statistical Division, filtered to be representative of owner occupiers.
Results and discussion
Responses to supplementary questions
The responses to a selection of supplementary questions is provided in Figure 2.
Figure 2: Responses to supplementary questions (% of respondents)
Almost half of the respondents (47%) rated public parks and gardens in their top five factors that they ‘most like’ about their suburb. In relation to the most liked features of local parks, the most common response was ‘open grassy areas’ (41% of respondents ranked this factor in their top five). While it is clear that grass is well-liked, we were interested to know more about peoples’ preferences for how this grassed area is managed.
In a follow up question about what changes to existing park features would improve the appeal of parks, we found that the most common preference was ‘more regular upgrading of existing facilities’ (34% of respondents ranked this in their top five). Just 10% ranked ‘keeping more grassed areas watered over summer’ in their top five.
When asked what features would reduce the appeal of parks, 21% thought that parks would become less appealing if less grassed area was kept green over summer. Most respondents were not opposed to converting some grass to native groundcover. Only 15% appear to hold the view that this would make parks less appealing. Among the top-ranked concerns for most respondents were the removal of trees, increased litter, and less well-maintained facilities.
Willingness to pay for green space
Values for green POS were estimated using responses to the CM questions. Parameter estimates for two choice models are shown in Table 3. One model uses the full data sample (total Community) and the other that is based on a subset of respondents that live in high-density residential areas.
Table 3: Parameter estimates for the choice model
Before discussing the value estimates, we note that just over a third of all respondents (38%) in the full data sample selected the base case option across all choice questions. We infer that this is the proportion of the community that prefer to let some green POS go brown over summer, as opposed to paying extra money through their rates to maintain watering levels.
When these respondents were asked why they had selected the base scenario, the majority gave reasons suggesting that the benefits of maintaining watering of POS throughout summer were not sufficiently high to justify any of the rate increases presented to them.
Figure 3 summarises the mean willingness to pay (WTP) values for each of the attributes tested and Table 2 presents the 95% confidence intervals around these mean values. The results show that on average, Perth households are WTP $1.00 per annum to avoid a 1% reduction in the area of green POS in their local area.
Thus, if councils responded to a licence reduction by reducing the area of green POS by 20%, the cost of lost amenity to the community is estimated to be $20 per household each year (the marginal value is linear over the entire range). When extrapolated to the 800,000 households in Greater Perth, we assess the total WTP for avoiding a 20% loss to be $16 million per annum.
Table 2: 95% confidence intervals for WTP estimates
Figure 3: Willingness to pay for POS attributes
The $1.00 per 1% loss of green POS is an average value across all households. When the choice model is re-estimated for just those households living in high density suburbs, the valuation increases to $1.48 per 1% change, which suggests that people living in these suburbs place a higher value on green POS, possibly because they only have a small garden on their own property, or none at all if living in an apartment.
Households are not willing to pay for a 10% increase in the proportion of POS kept green over and above current levels. While not statistically significant, the model suggests that this outcome would result in a ‘disutility’ of $13.70 per year (i.e. households perceive that they would be worse off by this amount if this policy was adopted). This may be due to concerns held by households about the scarcity of water and doubts about the prudence of using more water to irrigate larger areas of green grass.
Values for other attributes
In the case of other attributes examined, on average, people are WTP $0.87 for every 1% increase in the area of grass converted to native groundcover (suggesting that groundcover is a close substitute for grass over the range tested). Upgrades to park facilities are valued highly at $4.16 per year for each additional park that is upgraded. A value for public road verges and median strips kept green through summer is not shown because this variable was not statistically significant in explaining choices.
Care needs to be exercised in applying the results of this study to inform policy decisions because most of the mean values have high standard errors. For example, as shown in Table 2, the 95% confidence interval on the WTP estimate for maintaining green POS at current levels overlaps slightly with zero, implying that we cannot rule out the possibility that mean WTP is in fact zero. Furthermore, there is substantial heterogeneity in preferences across the sample. A formal test for heterogeneity in the attribute parameters indicated statistically significant levels of variability around the mean parameters for all four non-price attributes, at the 95% level of confidence. This indicates that the calculated mean values will reflect some degree of cancelling out of differing preferences within the community. It follows that the mean values alone may not adequately represent the diversity of preferences within the community.
Conclusion
This study has shown that, on average, the Perth community does value the maintenance of green POS over summer using current levels of watering, but the values are lower than might be expected, based on previous literature - such as the study by Ambrey and Fleming, which reported an average household WTP value of $1,168 for a 1% increase in green POS. By contrast, we estimated a WTP of just $1.00 per 1%. This divergence may be due to the fact that our study focused on the proportion of irrigated POS over summer (while holding total area of POS constant), while other studies (including the work by Ambrey and Fleming) have valued increases in the total area of POS.
Our findings indicate that households are relatively unconcerned about a 20% reduction in green grass over summer. A higher WTP may have been evident had more substantial reductions been tested.
The findings also demonstrate that people are prepared to trade-off green grass with substitutes such as native groundcovers and improved park facilities.
The valuation results help to inform policy decisions about the community impact of groundwater allocation cuts in Perth’s Gnangara area. About 154,000 households reside in this area, which collectively are estimated to be WTP $3.08 million to maintain POS in green condition over summer. If groundwater use for POS was restricted by 10 to 20 per cent in Gnangara region, this would imply a loss of between 4600 and 9200 megalitres (ML) for irrigation. If the consequent impact of this action meant that councils reduced their irrigated area by 20%, based on our findings, the community value for irrigation water would range between $0.33 to $0.67 per kilolitre (kL), depending on the volume restricted. This is an indication of the amount that community would be WTP for an alternative water source.
We note that this value is significantly lower than the current long run marginal cost of potable water in Perth, which is around $2.40/kL, so it would not be prudent or efficient to use potable water for maintaining green POS over summer. However, the value estimated for green POS is slightly higher than the average price paid by agricultural irrigators for groundwater in the trading market, which is around $0.25 per kL (or $250 per ML for an annual allocation). This suggests that in a scenario where long-term adjustments were required in the allocation of groundwater between POS use and agriculture, community may be able to ‘out bid’ agricultural users for groundwater.
Acknowledgments
This study was funded by the Western Australian Department of Water and Environmental Regulation as part of its investigations into developing a new groundwater allocation plan for the Gnangara area.
About the authors
Martin van Bueren | Martin is a resource economist and Director of Synergies Economic Consulting with 20 years of consulting experience. He frequently advises water utilities, policy agencies, regulators and other water sector stakeholders on contemporary issues confronting the sector, ranging from water security, demand management, customer engagement, water markets, pricing, competition, and environmental matters.
Russell Blamey | Russell is Senior Director Insights Analaytics at DBM Consultants and has over 25 years’ experience across academia and consulting in the economic valuation of non-market services. In previous roles he was an academic at the Australian National University and the University of New South Wales, both in Canberra.
References
Ambrey, C and C. Fleming (2012) Public greenspace and life satisfaction in urban Australia, Discussion Paper No. 2012-01, Griffith Business School.
CRC for Water Sensitive Cities (2017), ‘How much do we value POSs?’, Industry Note, Program A: Society, Project A1.1 and A1.2.
DWER 2018 (Department of Water and Environmental Regulation). Our groundwater future in Perth: Securing Gnangara groundwater and adapting to climate change, May 2018.
DWER 2019A. Studying Perth’s deep aquifers to improve groundwater management – Findings from the Perth Region Confined Aquifer Capacity study, Report No. 67, January 2019.
DWER 2019B Securing our groundwater future, available at: https://gnangara.dwer.wa.gov.au/collaborate/
Morrison, J. and L. Mathieson (2008) Scoping Study: Economic value of irrigation in urban green open space, EconSearch Pty Ltd.
Share